
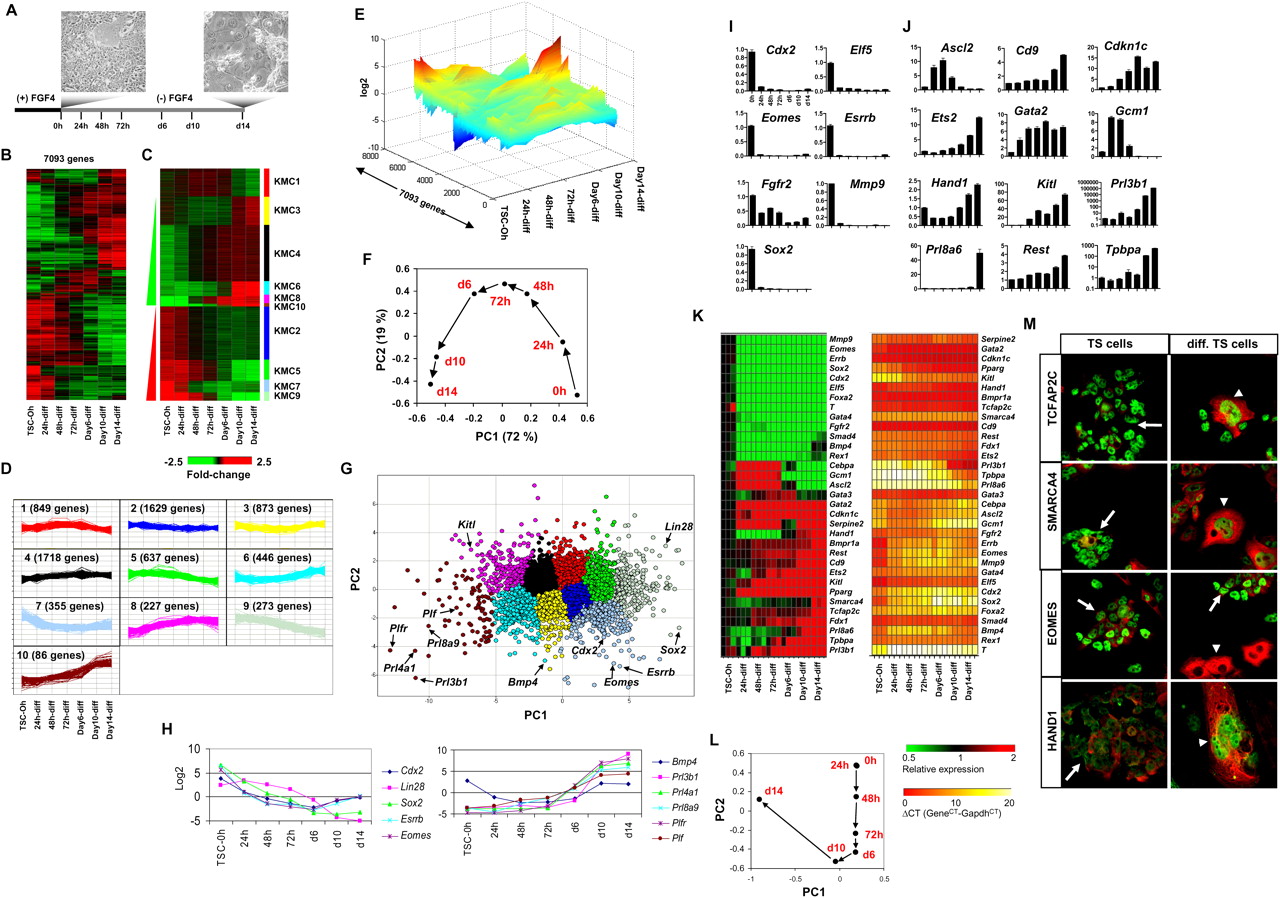
Microarray expression analysis of undifferentiated and time-course differentiated TS cells. (A) Experimental design. TS cells were cultured in MEF-conditioned medium in the presence of FGF4. TS cell differentiation proceeded in the absence of FGF4 over 14 d. RNA was collected from TS cells at 0 h, 24 h, 48 h, and 72 h and on day 6, day 10, and day 14. (B) Hierarchical clustering analysis (HCA) of differentially expressed genes (greater than twofold). (C) HCA of k-means-clustered differentially expressed genes. (D) Patterns of gene expression identified using k-means clustering. (E) Landscape view of k-means-clustered genes. (F) PCA plot of the first two principal components describing most of the data variability. (G) PCA plot of differentially expressed genes clustered according to k-means. (H) Log2 adjusted expression values of genes expressed in TS cells and differentiated cells. (I) Genes expressed in TS cells were down-regulated during differentiation. qRT-PCR expression analysis of genes enriched in undifferentiated TS cells or bound by at least one factor (Cdx2, Elf5, Eomes, Esrrb, Fgfr2, Mmp9, and Sox2). Data was normalized to Gapdh and then to the expression of TS cells cultured in the presence of FGF4 at 0 h. (J) Genes expressed in differentiated trophoblast and placental cells were up-regulated during TS cell differentiation. qRT-PCR expression analysis of trophoblast lineage-specific genes (Ascl2, Cd9, Cdkn1c, Ets2, Gata2, Gcm1, Hand1, Kitl, Prl3b1, Prl8a6, Rest, and Tpbpa), including genes also bound by at least one factor (Ets2, Gata2, Gcm1, Hand1, and Rest). (K) HCA of qRT-PCR gene expression data. Fold-change expression values were clustered with a green/black/red color scale. Expression values relative to Gapdh (Gene CT – Gapdh CT) were clustered with a red/orange/yellow color scale. (L) PCA of fold-change gene expression data obtained from qRT-PCR. Data plotted in the first two components reveal a stepwise progression of undifferentiated TS cells at 0 h to differentiated TS cells at day 14. (M) Confocal immunofluorescence analysis of TCFAP2C, SMARCA4, EOMES, and HAND1 expression in undifferentiated and differentiated TS cells. TCFAP2C and SMARCA4 expression is enriched in both undifferentiated and differentiated TS cells, EOMES expression is enriched in undifferentiated TS cells, and HAND1 expression is enriched in differentiated TS cells. TCFAP2C, SMARCA4, EOMES, and HAND1 are labeled in green, and Cytokeratin is labeled in red. Arrows indicate undifferentiated TS cells, and arrowheads indicate differentiated trophoblast cells.


