
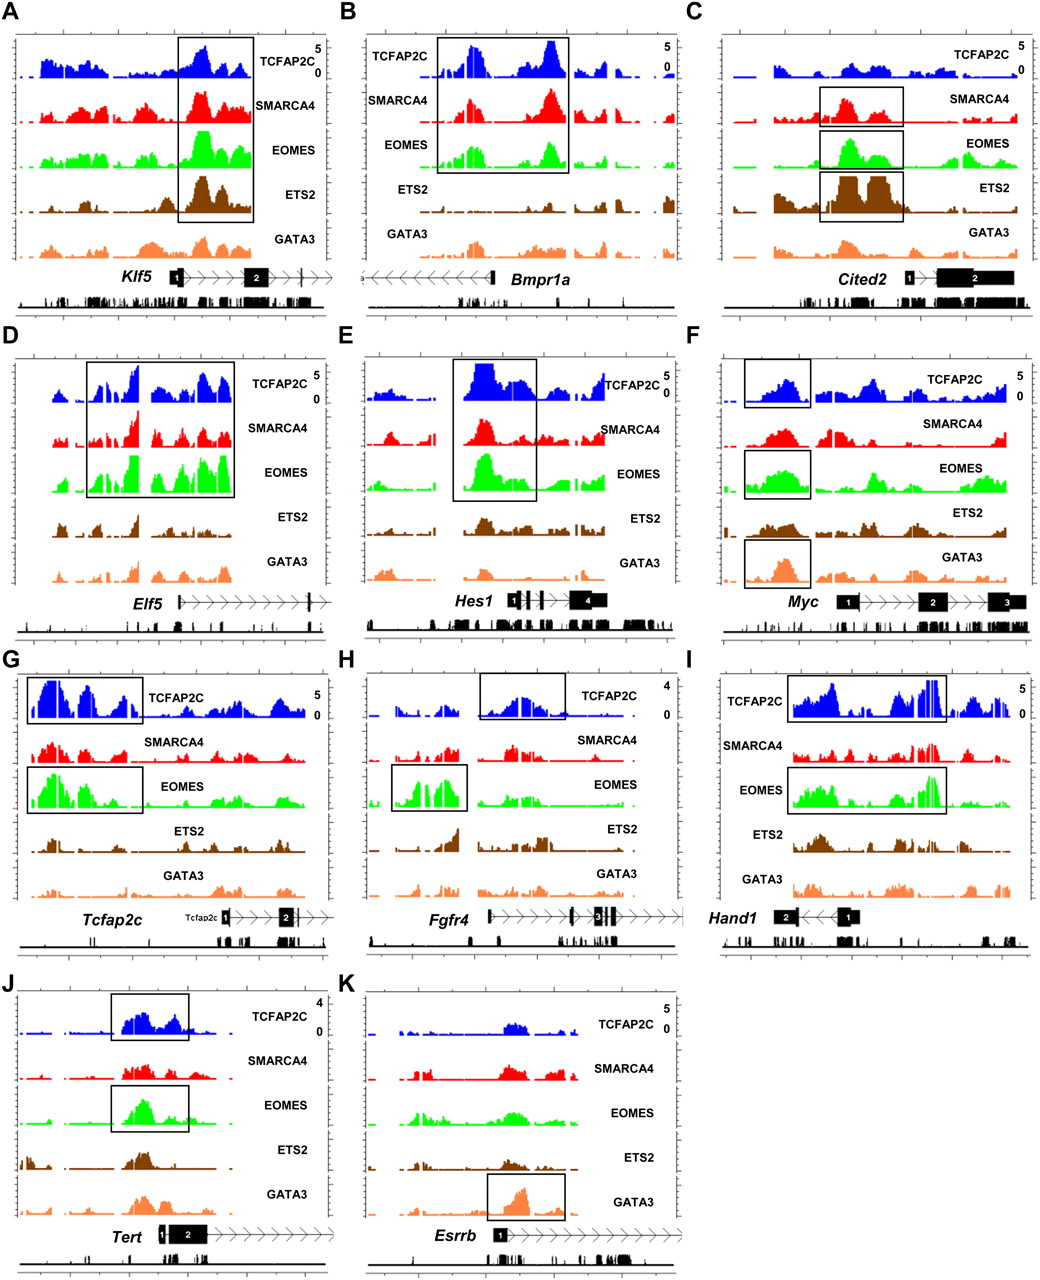
Figure 3.
Genomic view of TF binding in TS cells. TF binding site analysis at target gene loci. Representative profiles of TS cell–enriched genes occupied by four (A), three (B–F), two (G–J), and one (K) factor(s). MA enrichment values adjusted to log2 and conservation are shown on the plot.


