
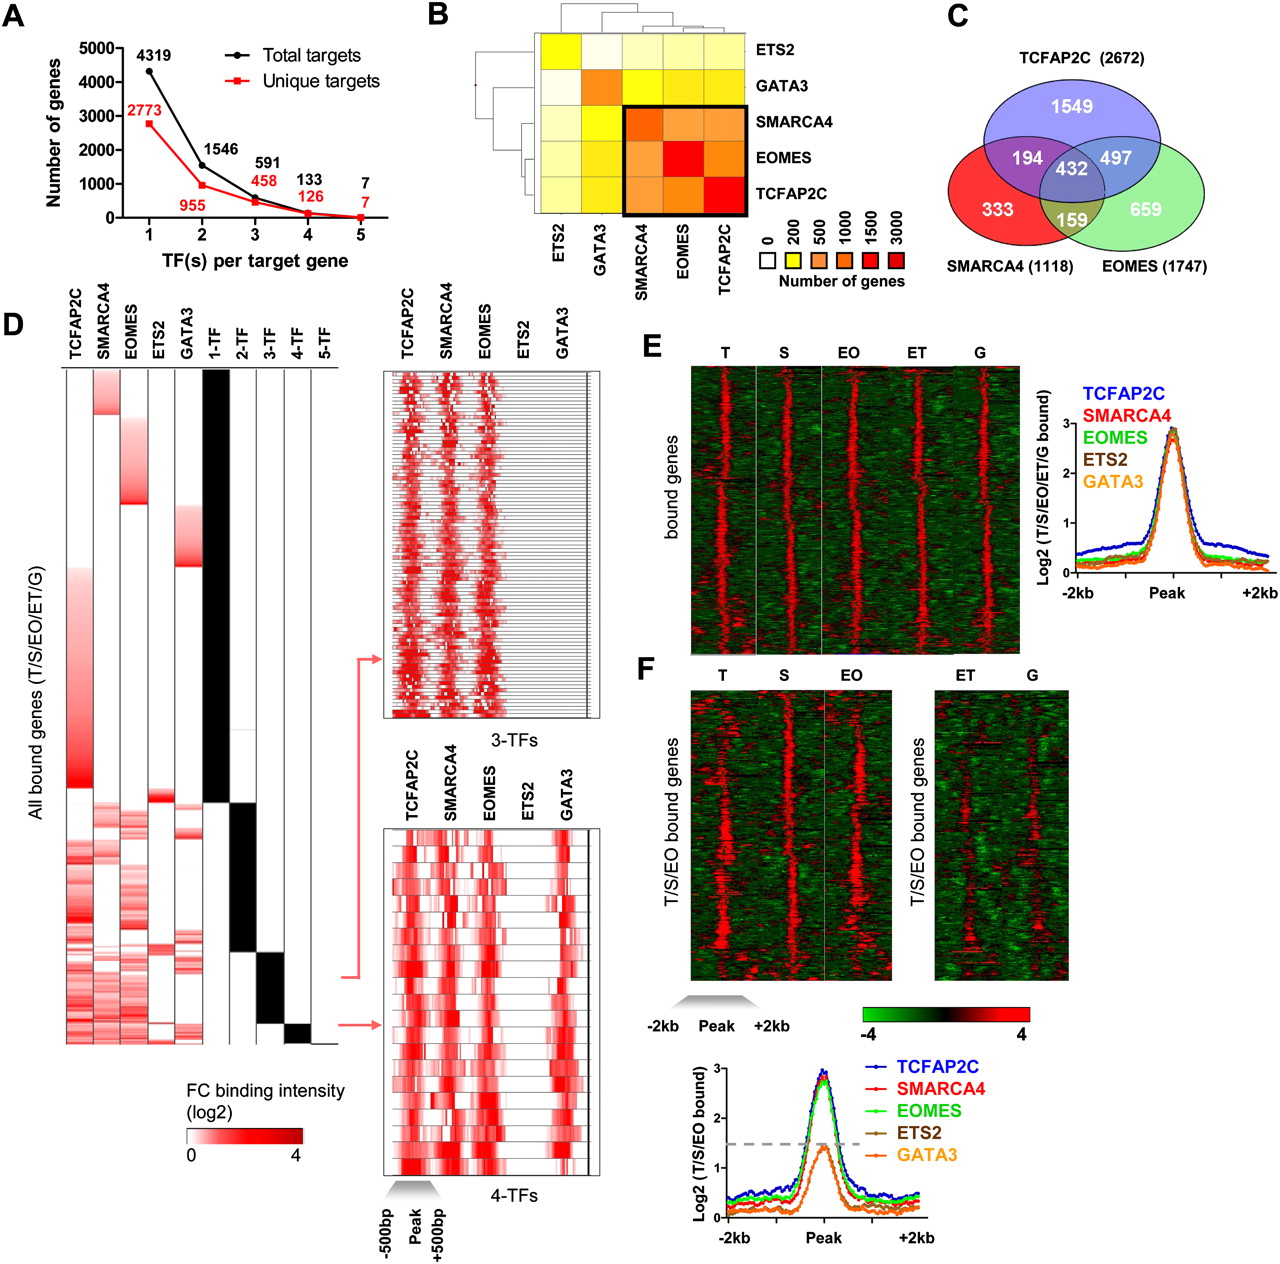
Multiple transcription factor occupancy at target genes. (A) Number of target genes occupied by multiple factors. X-axis represents the number of factors per target gene, and the y-axis represents the number of genes occupied by multiple factors. (Black dots) Total targets occupied by at least N-factors. (B) Factor co-occupancy. Heat map colors reflect co-occurrence of factor pairs, where red indicates a higher and yellow indicates a lower number of genes. One major cluster includes factors TCFAP2C, SMARCA4, and EOMES. (C) Venn diagram showing the relationship between TCFAP2C, SMARCA4, and EOMES bound genes. (D) Max fold-change binding profiles for accumulated target genes of all factors were clustered to reveal binding patterns. Representative binding profiles of 3-TF and 4-TF target genes were centered on enrichment peaks [−500 bp, +500 bp] and clustered using Spotfire. (E) TF binding profiles were centered on enrichment peaks [−2 kb, +2 kb] and clustered using Spotfire. Average binding profiles of 5-TFs are also shown. (F) Promoter profiles of TCFAP2C (T), SMARCA4 (S), and EOMES (EO) common target genes were clustered. Note the enriched binding of TCFAP2C, SMARCA4, and EOMES relative to ETS2 (ET) and GATA3 (G) at target loci. Average binding profiles of TCFAP2C, SMARCA4, and EOMES at common target loci are also shown.


