
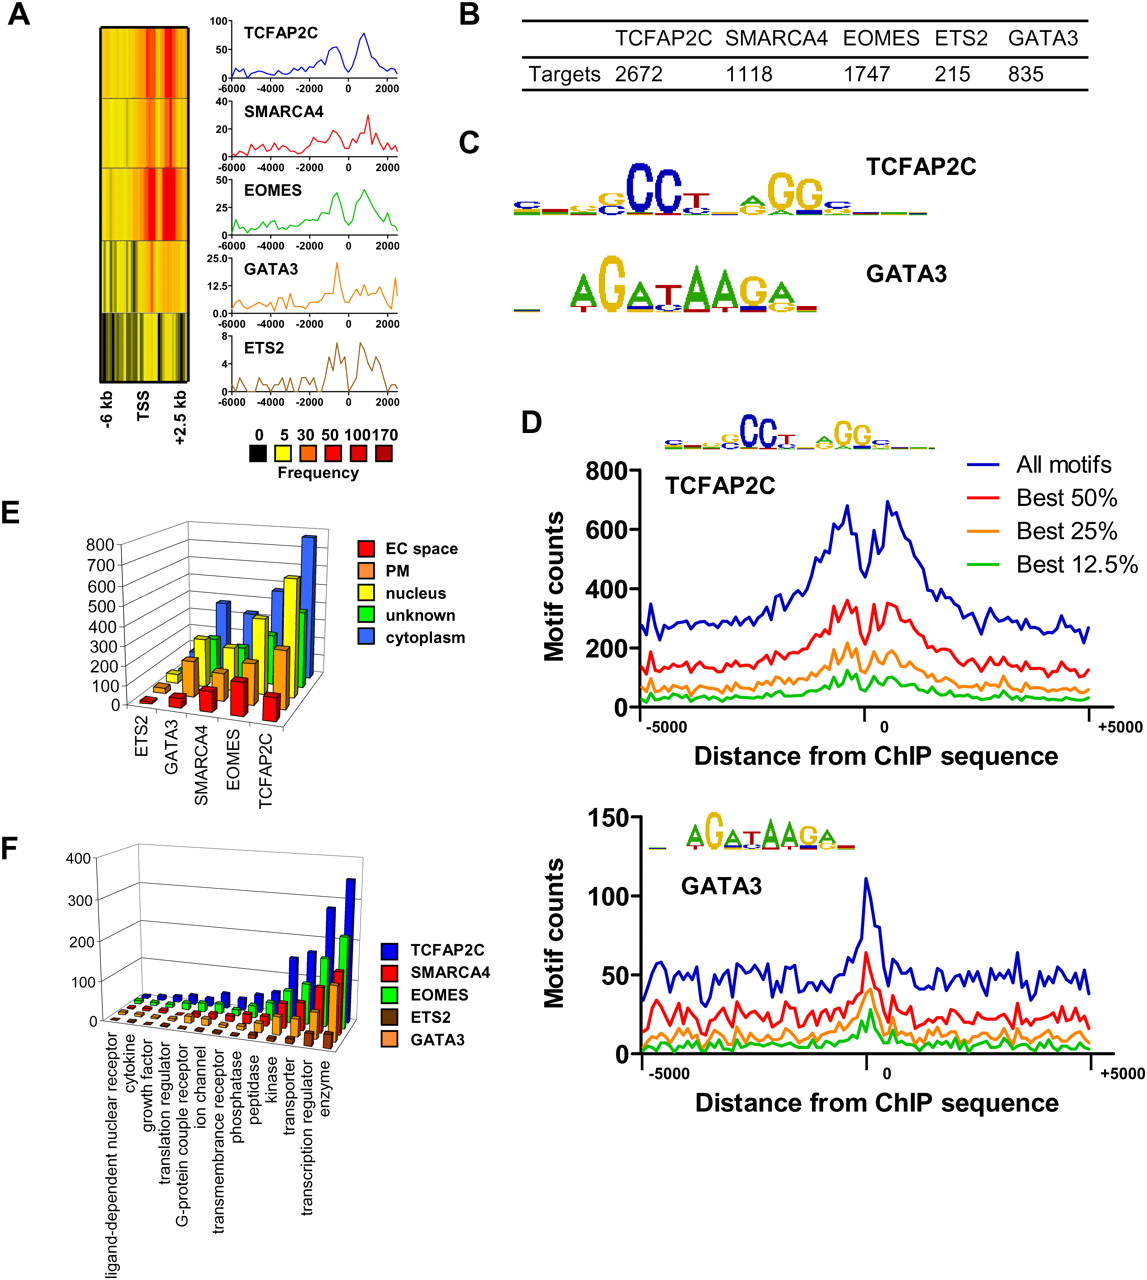
Analysis of TF binding in TS cells. (A) Distance of binding regions relative to the nearest transcriptional start site (TSS). (B) Number of target genes occupied by each TF or transcriptional regulator. (C) Enriched DNA binding motifs for TCFAP2C and GATA3 identified using CisFinder software (http://lgsun.grc.nia.nih.gov/CisFinder/). (D) TCFAP2C and GATA3 binding motifs are overrepresented in ChIP-enriched regions. Genomic sequences (10,000 bp) centered on ChIP-enriched TCFAP2C or GATA3 binding regions were extracted from the genome and evaluated for the number of TCFAP2C and GATA3 motifs. CisFinder software was used to generate position-frequency matrices (PFM) for TCFAP2C and GATA3 binding motifs. We assumed five false-positives per 10 kb of random sequence. (E) Gene Ontology (GO) functional annotation of bound genes was performed using ingenuity pathway analysis (IPA). GO terms for cellular location include extracellular space (EC), plasma membrane (PM), nucleus, unknown, and cytoplasm. (F) GO terms for biological function identified using IPA.


