
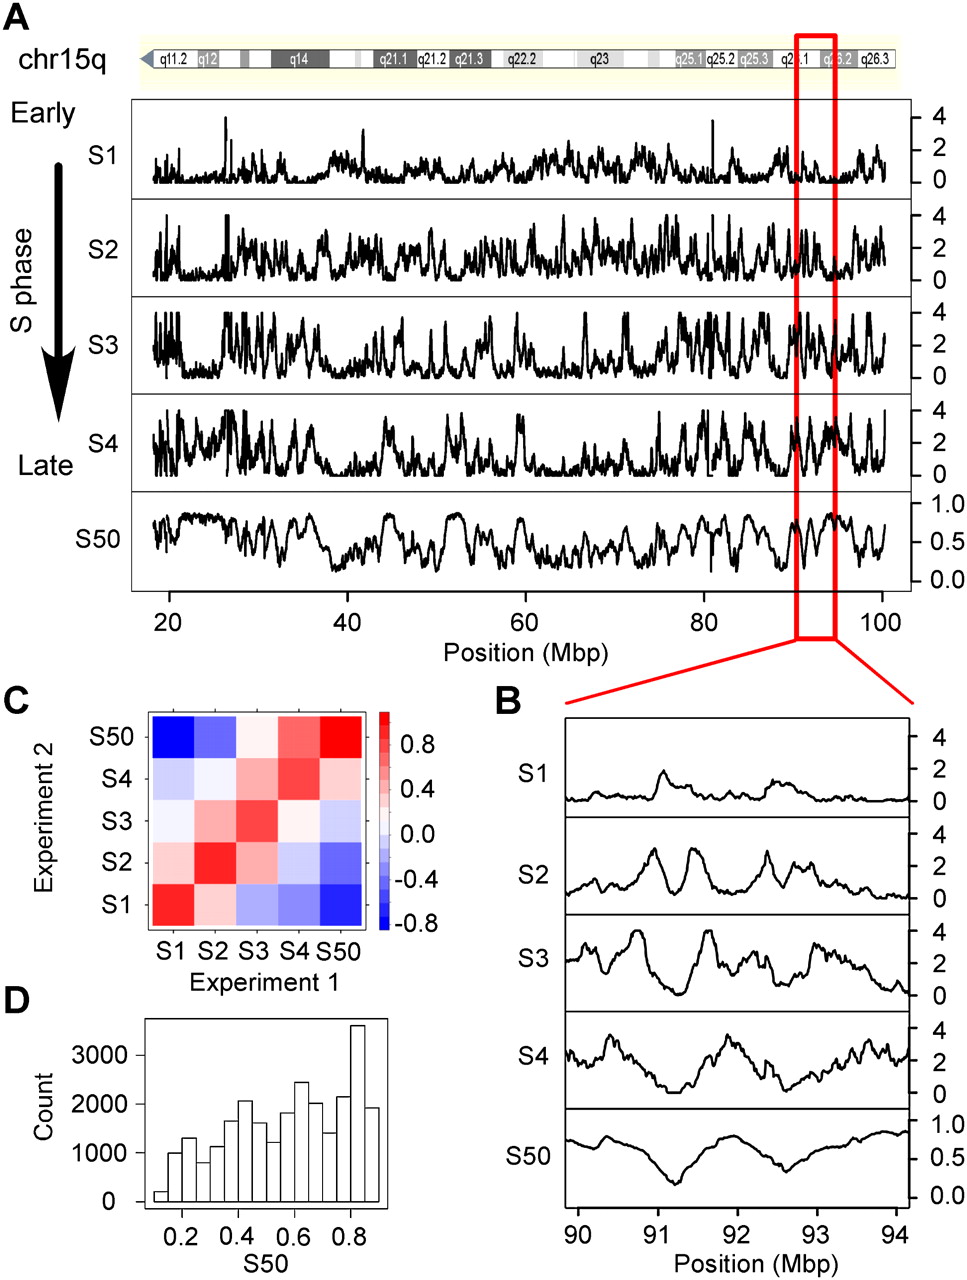
Analysis of the replication timing profiles. (A) Profile along human chromosome 15q of the enrichment of sequence reads E computed in 100-kb windows, in four periods of the S phase, S1, S2, S3, S4; S50, profile of the replication timing values (Methods). Small S50 values correspond to early replicating regions; large S50 values correspond to late replicating regions. (B) Enlarged view of E and S50 profiles along a fragment of chromosome 15. (C) Pairwise correlations (Pearson) between the enrichment E determined in the Si periods of the S phase and the S50 values of Experiments 1 and 2. Colors indicate the range of correlation coefficient values; positive correlations are observed only between neighboring Si fractions; S50 values are negatively correlated with S1 and positively correlated with S4. This confirmed that different alleles of the same region were usually replicated at similar periods of the S phase (Farkash-Amar et al. 2008). (D) Histogram of S50 values in the whole genome.


