
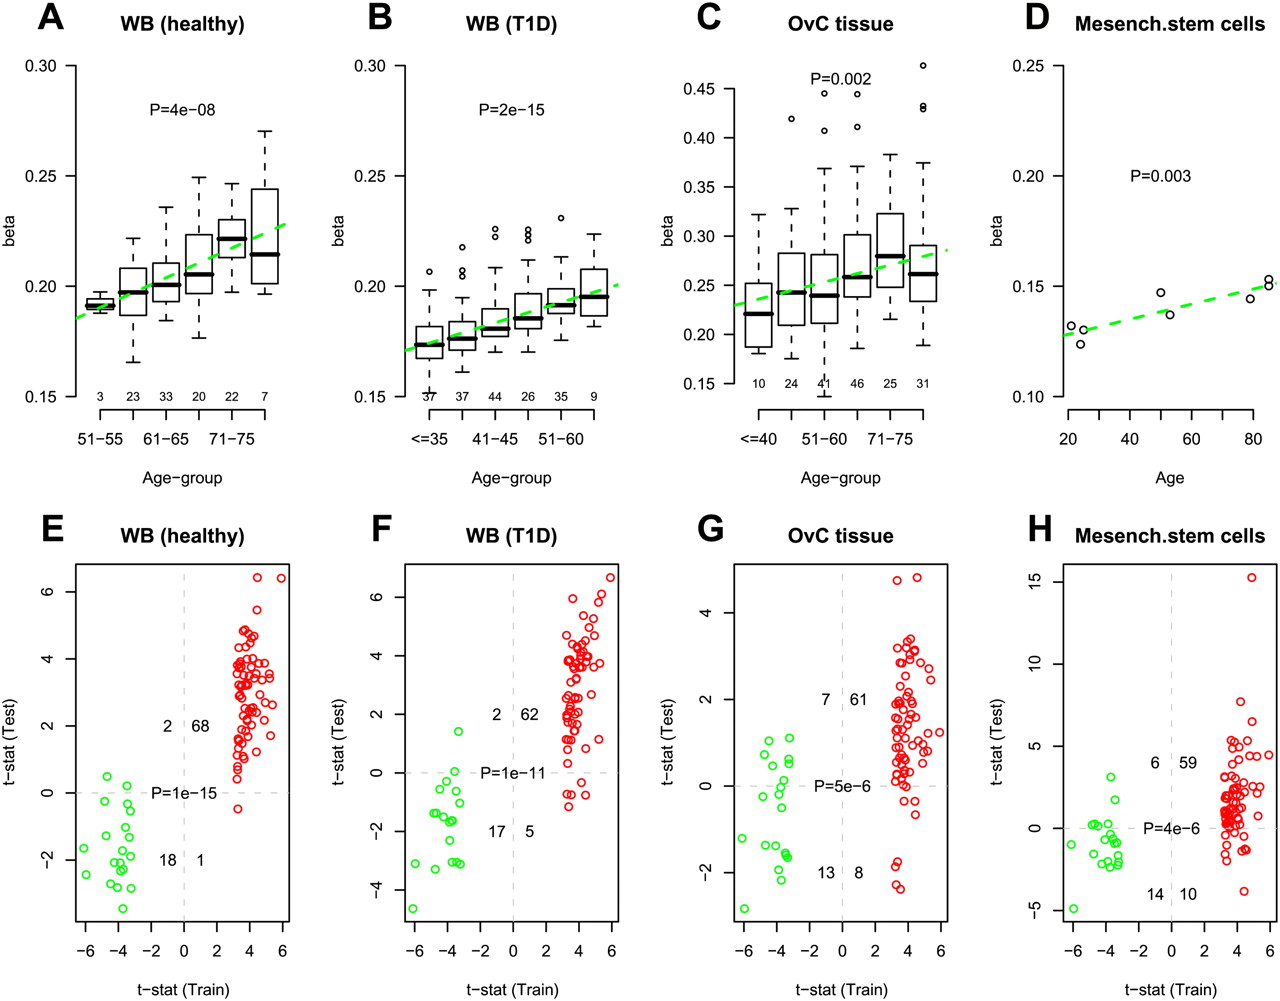
External validation of specific age-associated PCGT DNAm signature. (A–D) Average beta-methylation values over the 69 age-hypermethylated PCGTs (y-axis) as a function of age (x-axis) in validation data sets. Number of samples in each age group are given above the x-axis. t-test P-values for linear trend derived from a robust linear regression are given; (green dashed line) best linear fit. (E–H) Validation of age-associated (69 hypermethylated and 20 hypomethylated) PCGT CpGs in test sets. (X-axis) t-statistic of the linear regression test of age vs. methylation in the training set (blood samples from 148 healthy + 113 pretreatment ovarian cancer cases). Colors reflect directionality: (red) hypermethylated, (green) hypomethylated. (Y-axis) t-statistic of the linear regression test of age vs. methylation in the test set. We provide the number of CpGs displaying significant hyper/hypomethylation in the training set and hyper/hypomethylation in the test set, as well as the corresponding Fisher's exact test P-value. (A,E) Test set of blood samples from an independent set of 108 healthy individuals spanning an age range of 50–80 yr. In A, age was categorized into six age groups (50–55, 56–60, 61–65, 66–70, 71–75, >75). (B,F) Test set of blood samples from 188 T1D patients spanning an age range of 24–74 yr. In B, age was categorized into six age groups (≤35, 36–40, 41–45, 46–50, 51–60, >60). (C,G) A test set of ovarian cancer samples from 177 ovarian cancer patients spanning an age range 24–88 yr. In C, age was categorized into six age groups (≤40, 41–50, 51–60, 61–70, 71–75, >75). (D,H) A test set of eight bone marrow mesenchymal stromal cell samples from healthy donors of the following ages: 21, 24, 25, 50, 53, 79, 85, 85 (Bork et al. 2010).


