
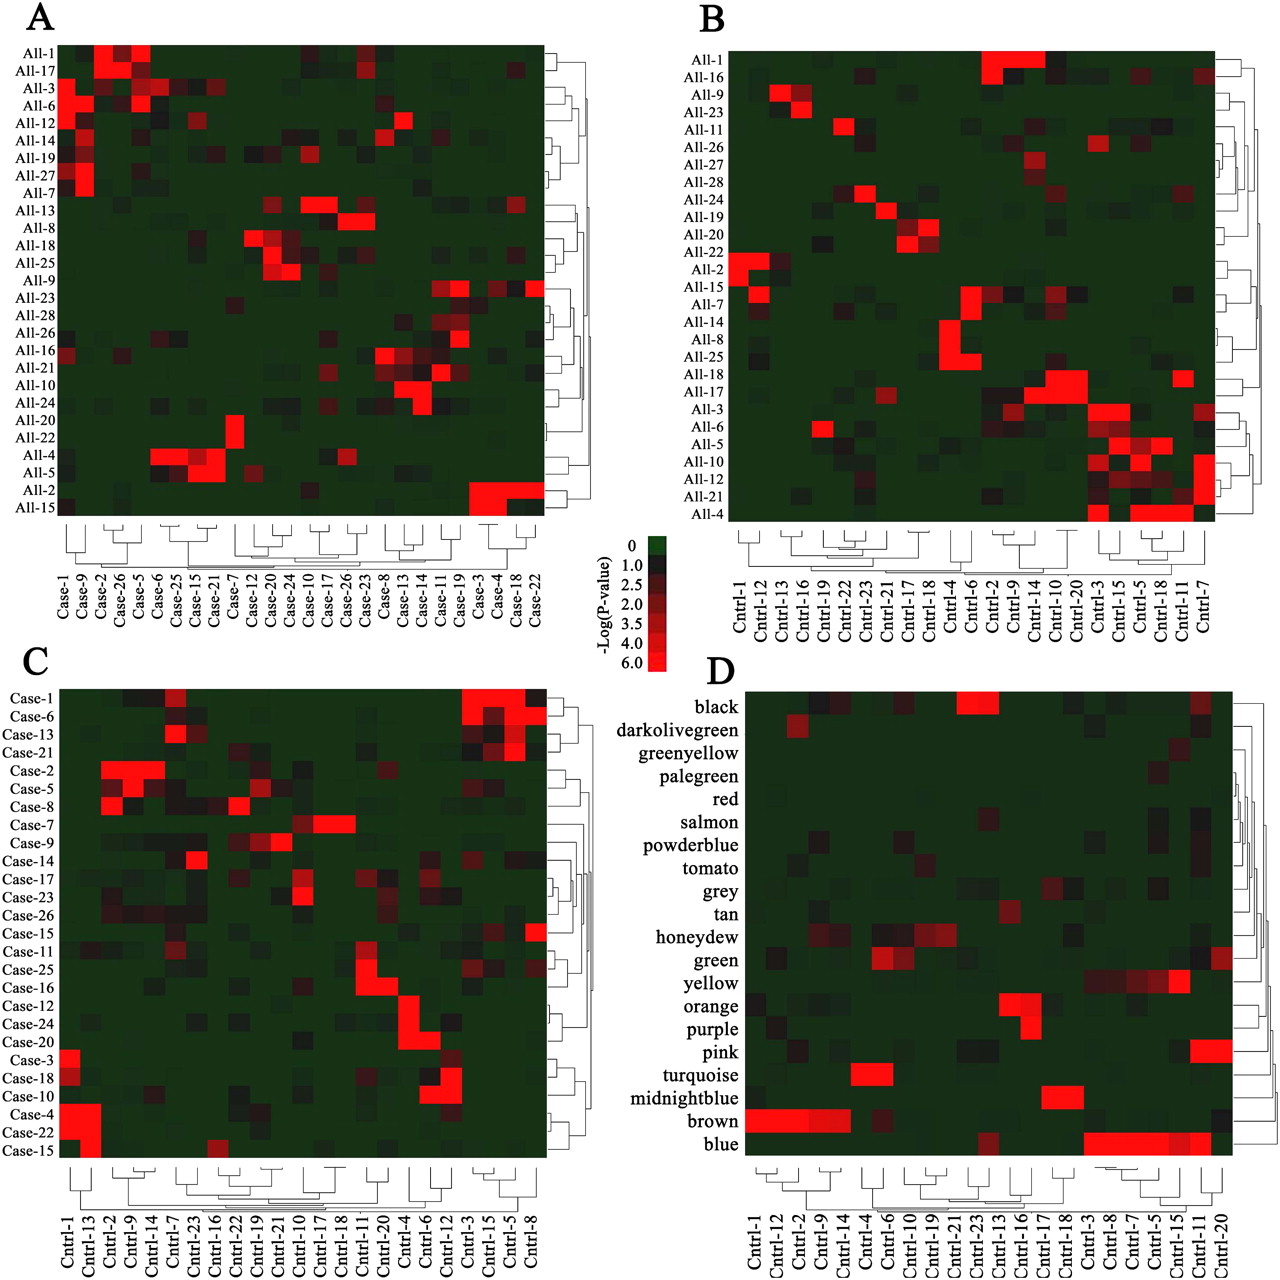
Figure 1.
Gene network overlaps. Heatmaps displaying the overlap between the combined case and control networks (“ALL1-28”) versus case networks (“Case 1-26”) (A), the combined case and control networks versus control networks (“Cntrl 1-23”) (B), the case versus control networks (C), and the control networks and those generated by Oldham et al. (2008) indicated by color names (D). Red indicates a significant overlap of gene composition in the designated modules according to the scale shown.


