
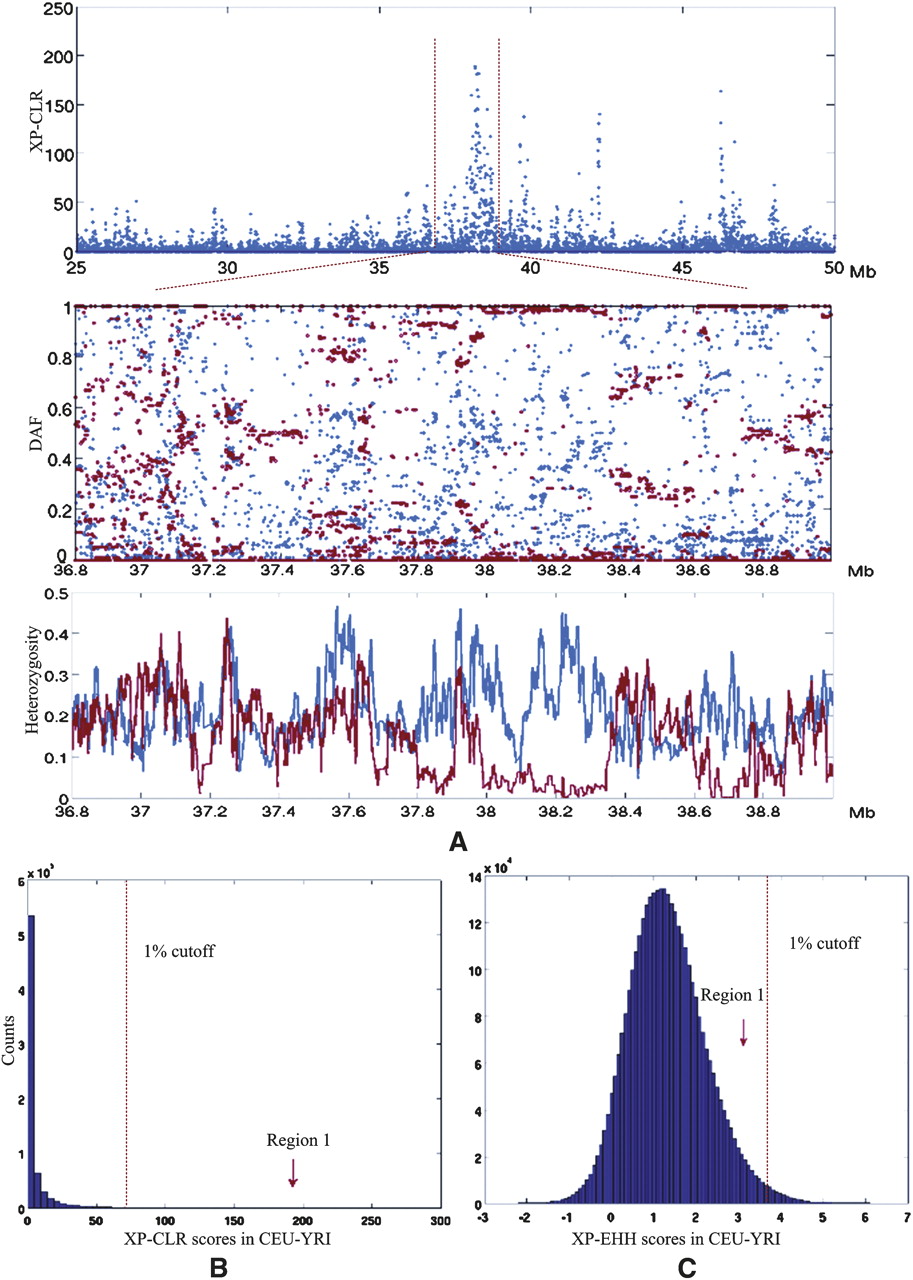
Figure 7.
(A, top) The plot of XP-CLR scores along chromosome 11 from the CEU-YRI comparison. (Middle) The derived allele frequencies of SNPs in YRI (blue dots) and CEU (red dots) populations in the zoomed region. (Bottom) Heterozygosity in the same region. (blue line) The average heterozygosity of 20 SNPs in the YRI population; (red line) CEU. (B,C) Histograms of genome-wide XP-CLR scores (B) and XP-EHH scores (C) in the comparison of CEU-YRI populations. The red arrows indicate the ranks of XP-CLR and XP-EHH scores relative to the genome-wide average.


