
Figure 6.
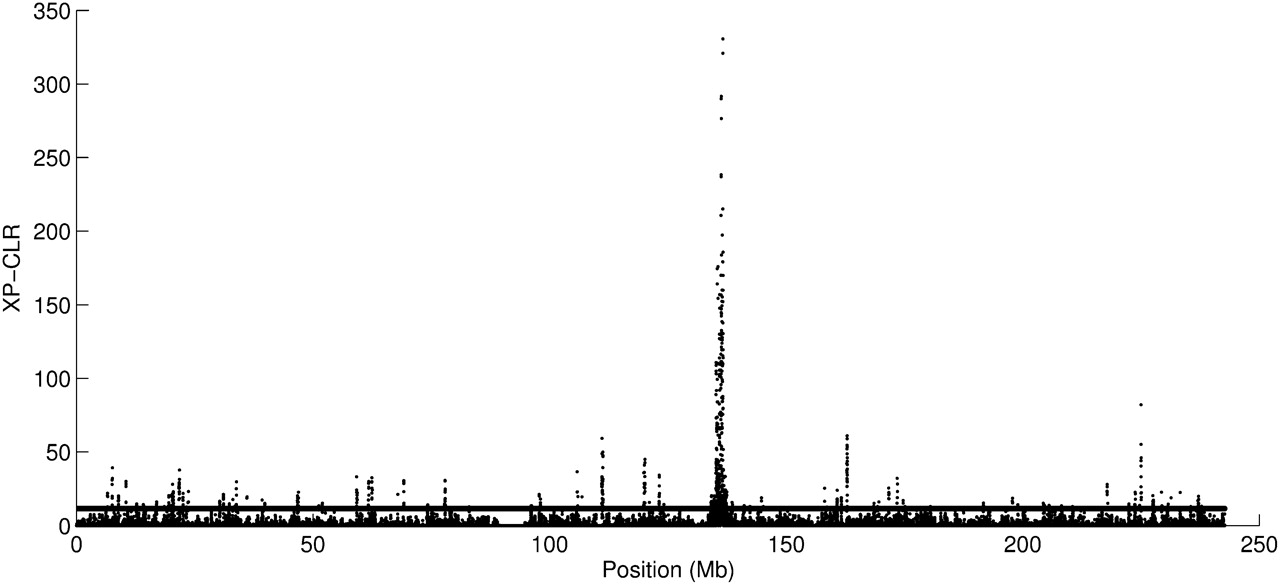
Plot of XP-CLR scores along chromosome 2 in a Northern–Southern European population comparison. The horizontal line indicates a 1% genome-wide cutoff level.
(Downloading may take up to 30 seconds. If the slide opens in your browser, select File -> Save As to save it.)
Click on image to view larger version.
Plot of XP-CLR scores along chromosome 2 in a Northern–Southern European population comparison. The horizontal line indicates a 1% genome-wide cutoff level.
 CiteULike
 Delicious
 Digg
Digg Facebook
 Google+
 Reddit
 Twitter
