
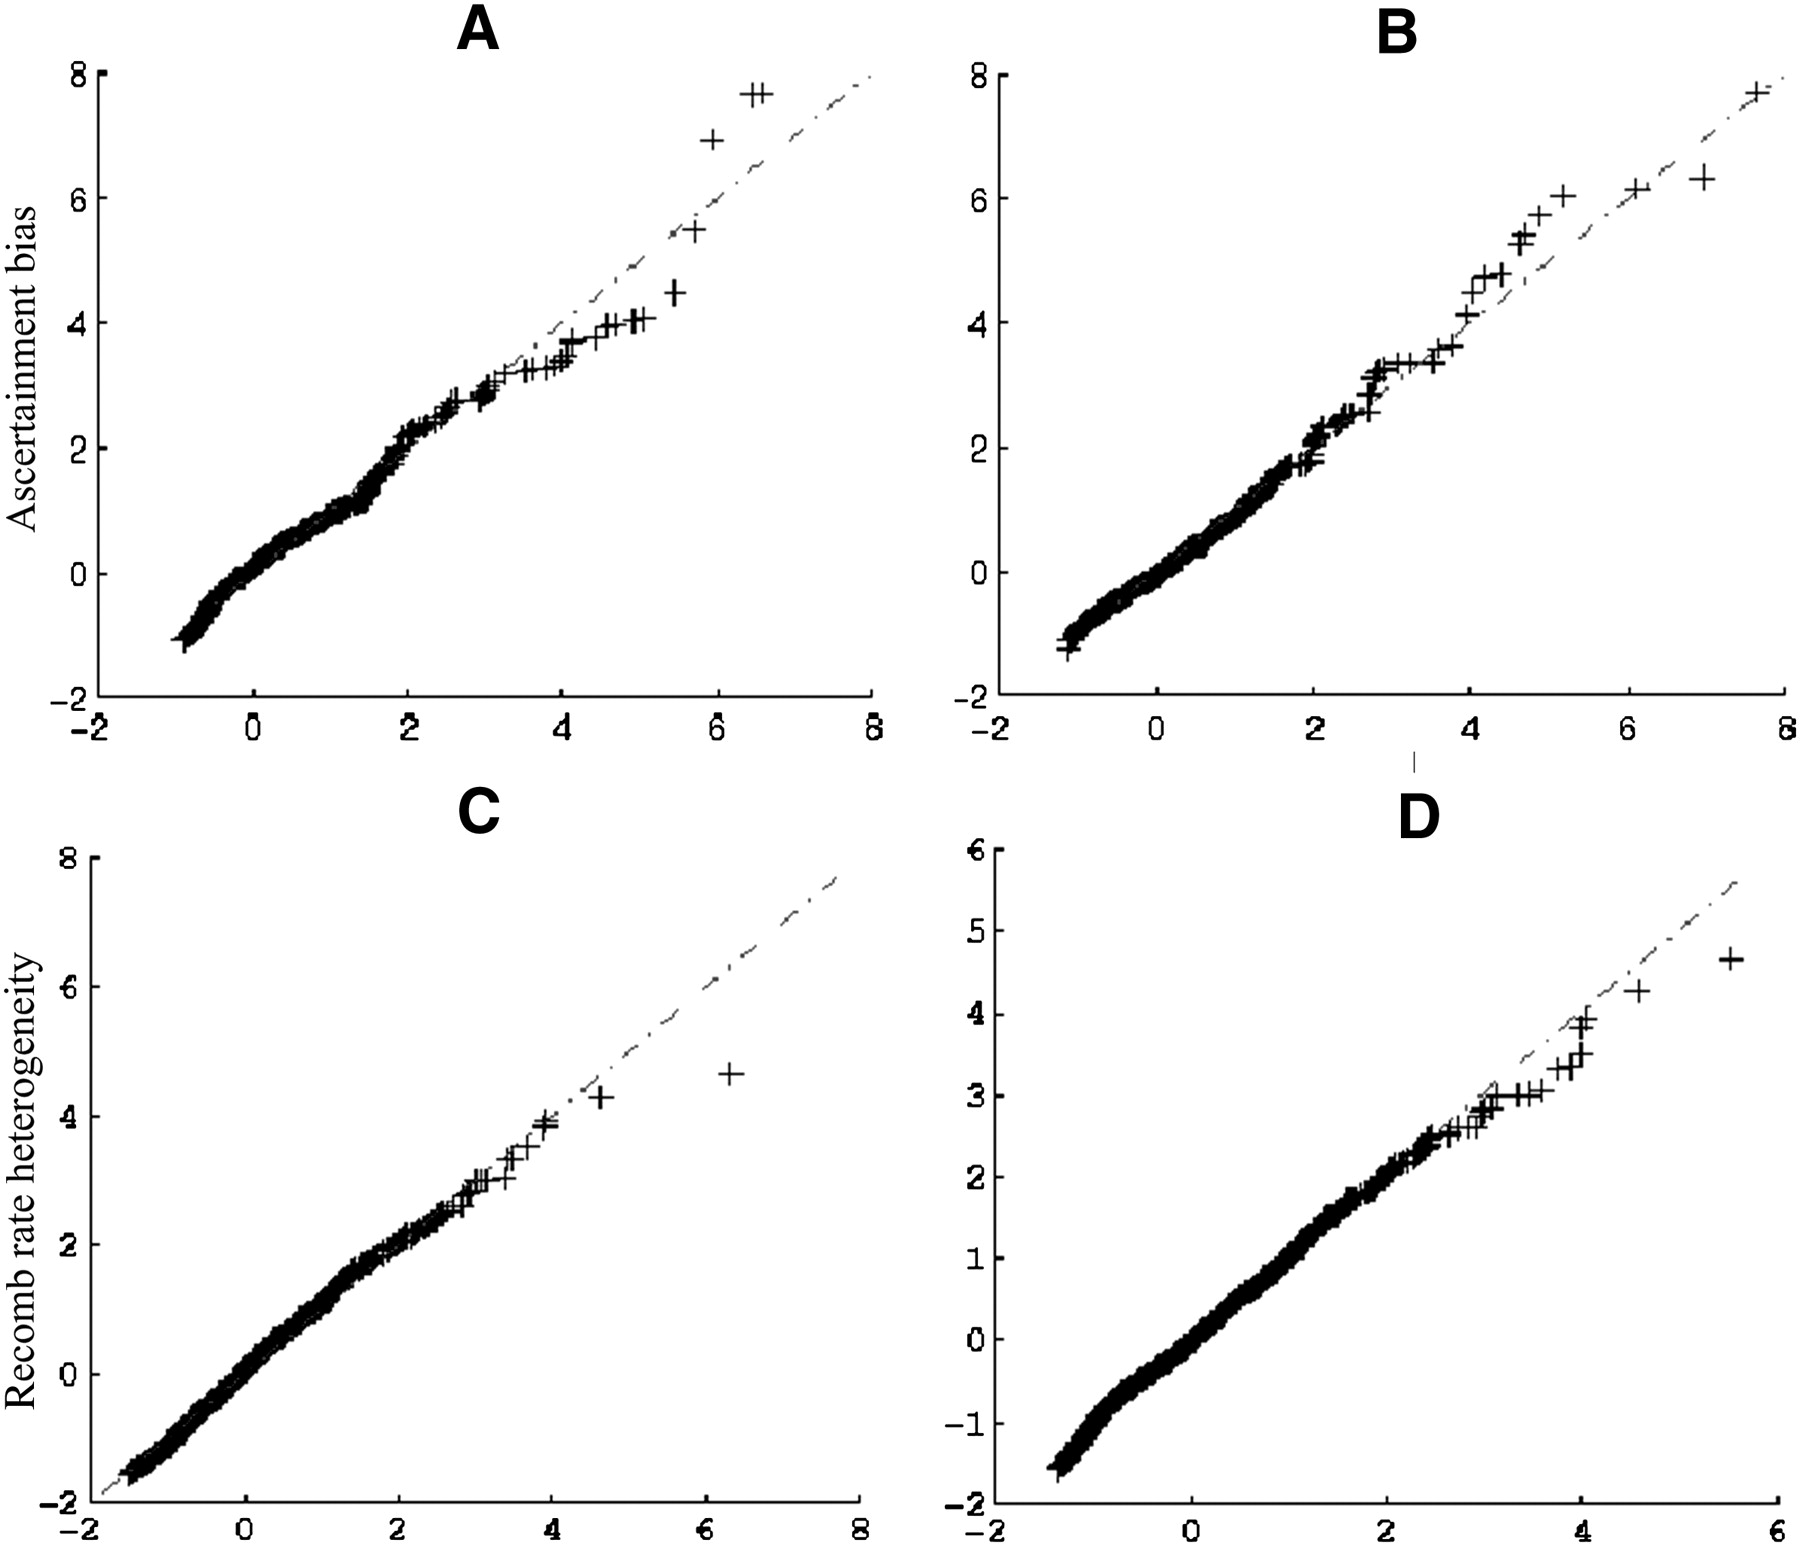
(A,B) A comparison of XP-CLR scores calculated from simulations of an ascertainment bias scheme in which SNPs are discovered in a pilot sample that included two chromosomes from each population. (A) Constant population size model with divergence time of T = 700 generations ago. (B) Constant population size model with divergence time of T = 3000 generations ago. Note that the XP-CLR scores in the figures were normalized. (C,D) A comparison of XP-CLR scores calculated from simulations of models assuming constant recombination rates with those including recombination hotspots or misspecified recombination rates. (C) The recombination hotspot model. (D) Estimated recombination rate is one-fourth of the true recombination rates. XP-CLR scores were normalized before this analysis.


