
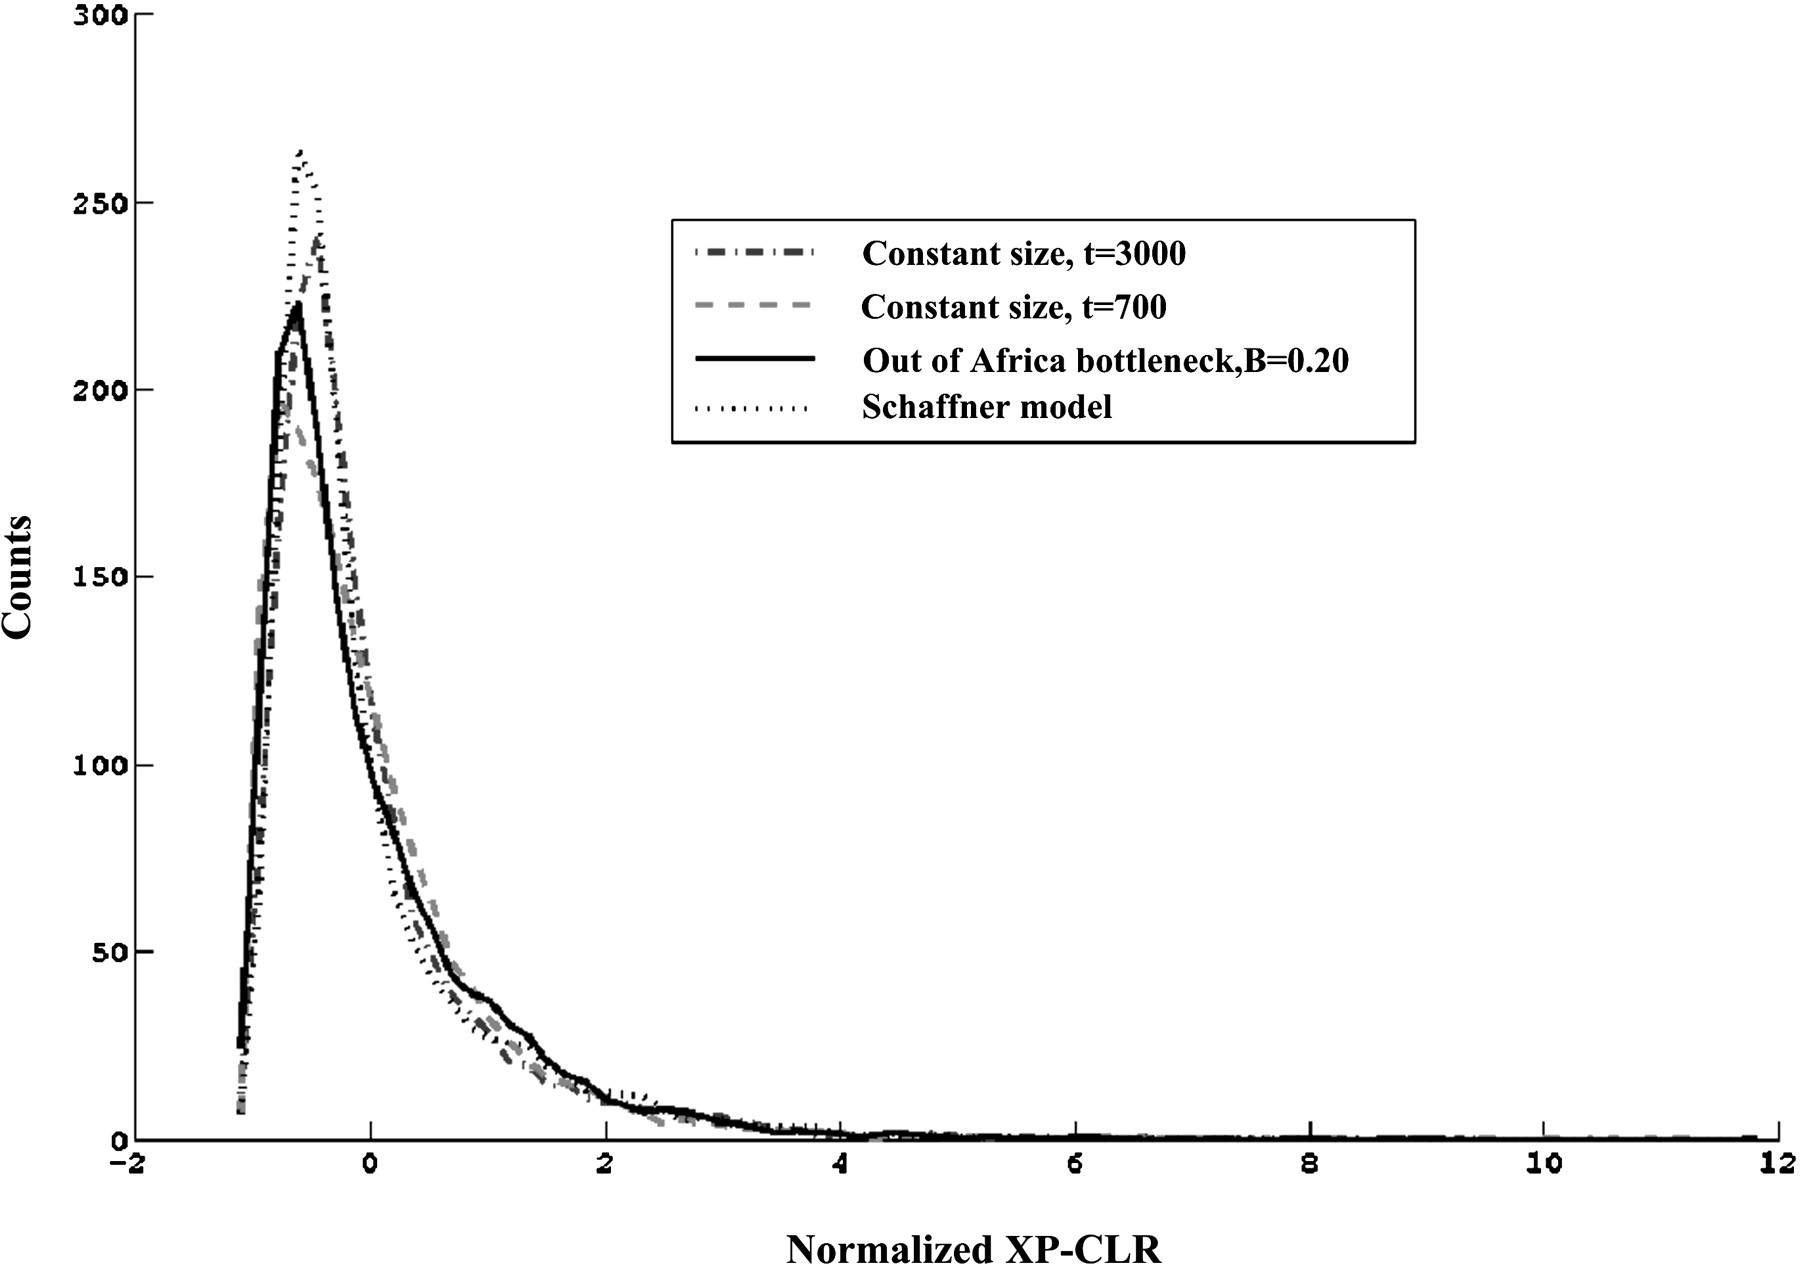
Figure 3.
The empirical distributions of XP-CLR scores normalized by their means and variances under a variety of demographic scenarios, showing the robustness to demographic histories.


