
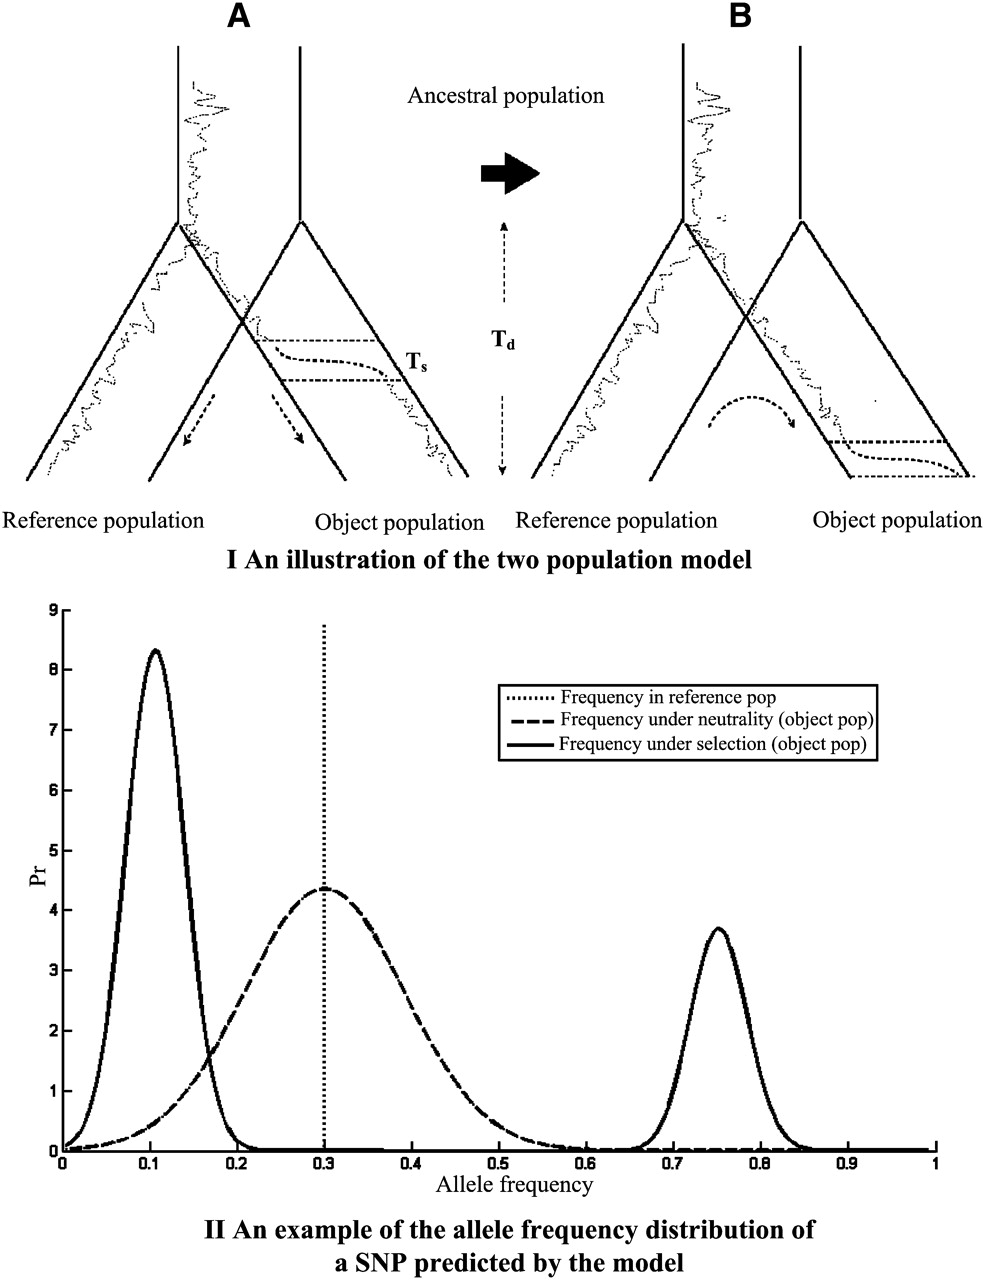
(Top panel) Illustration of the two-population model. (A) The two populations split at divergence time Td. The dotted lines represent the historical frequencies of an allele in the two populations; the dashed lines represent the increase of its allele frequency during the selection phase due to hitchhiking with a nearby advantageous allele. (B) Illustration of the modeling procedure. Starting from the observed allele frequency of a SNP in the reference population, the model predicts the allele frequency distributions under neutrality or selection in the object population. (Bottom panel) An example of the allele frequency distribution of a SNP near a putatively selected allele in the object population under selection (Equation 4, solid line) and neutrality (Equation 1, dashed line). The vertical dotted line represents the allele frequency of the SNP in the reference population (p2 = 0.3). The ratio r/s of genetic distance between the SNP and the advantage allele mutant divided by selection intensity is 0.05. The two populations are both assumed to have effective sizes 10,000. The divergence time ω is set to be 0.04.


