
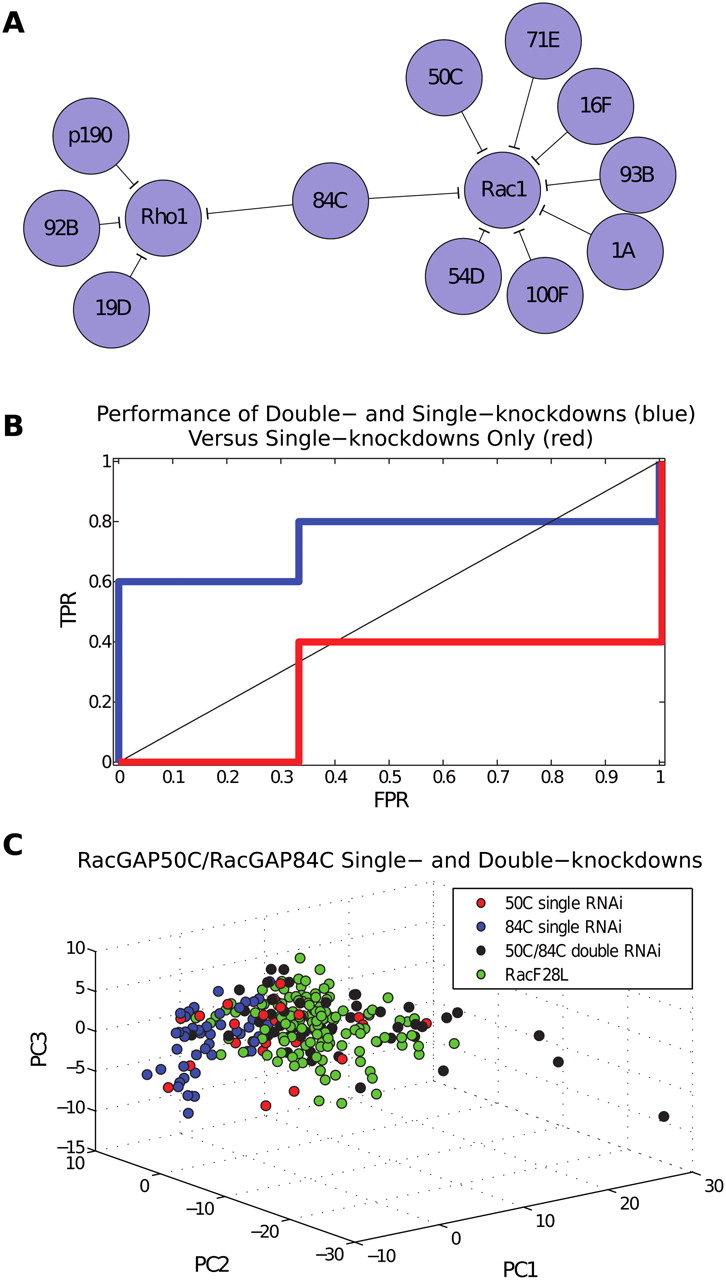
Inference using morphological data from single- versus double-knockdown RhoGAP treatment conditions. (A) Classification of both single- and double-knockdown RhoGAP TCs to RhoGTPase overexpression TCs. All pairs listed here are significant at optimal threshold, as determined by ROC analysis. The model correctly predicts four out of five biologically validated interactions and two out of three non-interactions. Overall, the model made 12 out of 39 possible predictions, yielding a P-score of P < 0.025 for identifying four out of five positive interactions. The model mapped several RhoGAPs to Cdc42, but none with sufficient significance (for complete results, see Supplemental Table 3). Network visualization was performed using Cytoscape (Shannon et al. 2003). (B) ROC curve showing single-knockdown (red) versus double-knockdown (blue) predictive models. For the single-knockdown model, the optimal threshold yields the only model that makes better predictions than random guessing. For the double-knockdown model, given that the set of validated interactions is likely incomplete, we err on the side of producing more false positives, and prefer (0.33, 0.80) to (0, 0.60). (C) RacGAP50C and RacGAP84C single- and double-knockdowns. The plot in PC-based coordinates shows single-cell point sets for RacF28L, RacGAP50C single-knockdown, RacGAP84C single-knockdown, and RacGAP50C/RacGAP84C double-knockdown. The classification model maps the RacGAP50C single-knockdown to RacF28L with low confidence and incorrectly maps the RacGAP84C single-knockdown to Rho1 with high confidence, but correctly maps the RacGAP50C/RacGAP84C double-knockdown to Rac1 with high confidence.


