
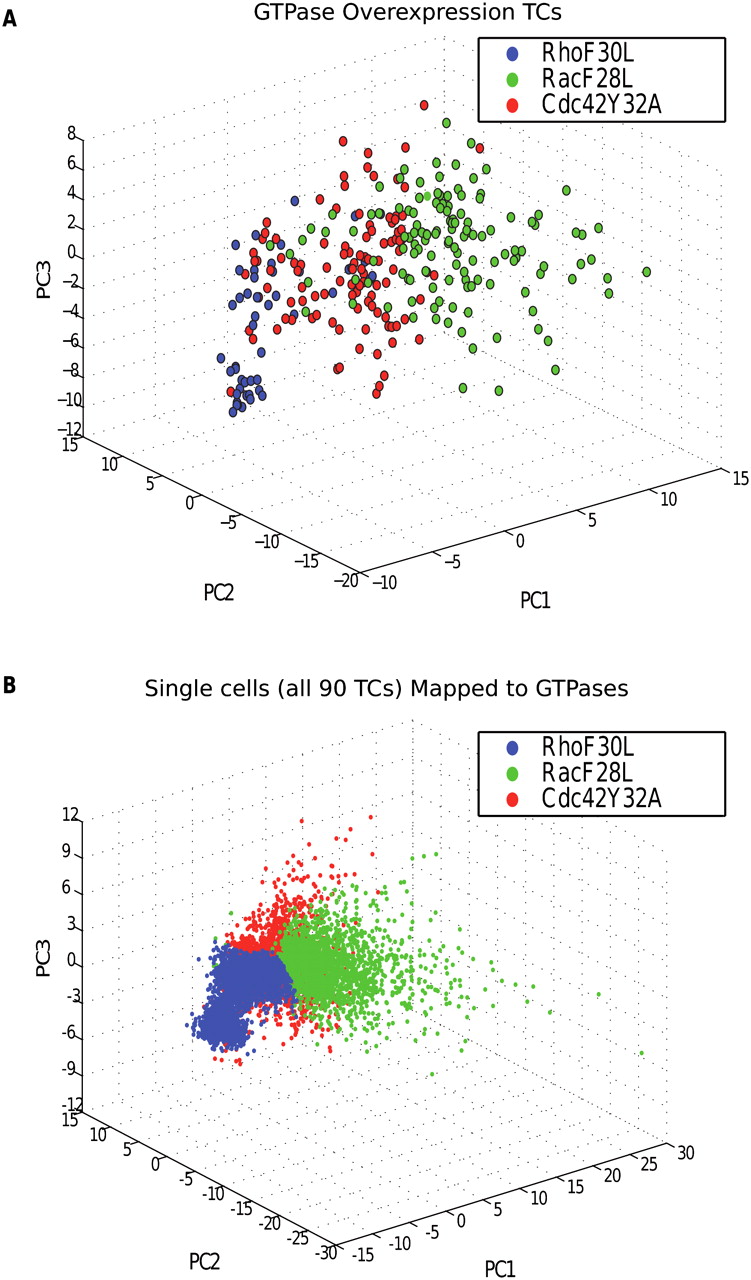
Figure 3.
Point sets for RhoGTPase overexpression TCs and corresponding phase space. Point sets for RhoGTPase overexpression TCs and classification of all single cells in the double-knockdown screen. (A) Point sets for RhoF30L (blue), RacF28L (green), and Cdc42Y32A (red) shown in reduced-dimensional feature space. (B) The mapping of all 6480 single cells from the double-knockdown RhoGAP screen to RhoGTPase overexpression TCs. In effect, the classification model defines a phase space for mapping single cells in the set of upstream TCs to the set of downstream TCs.


