
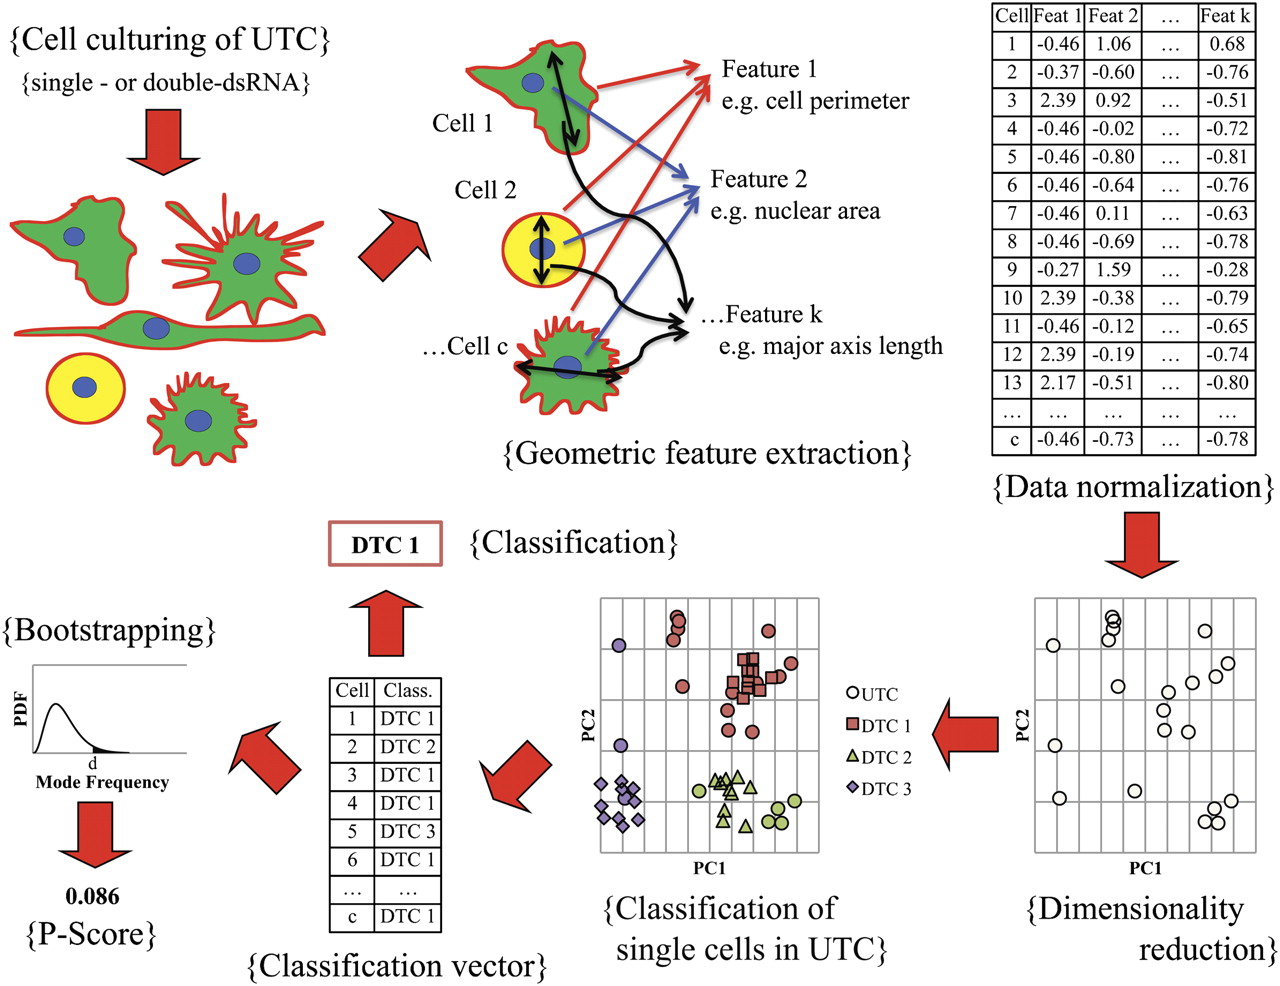
Workflow for classification of upstream TCs (UTC, e.g., RhoGAPs) to downstream TCs (DTC, e.g., RhoGTPases) using high-throughput morphological data. Cell culture was subjected to a variety of genetic perturbations, multiple single-cell images were acquired for each treatment condition, and raw geometric features were extracted for each single cell (upper left, upper middle). Raw data was subjected to normalization (upper right) and dimensionality reduction. The single cells comprising each downstream TC and upstream TC were represented as points in reduced feature space (bottom right, shown for UTC). Each cell of UTC was mapped to a DTC by computing a modified Euclidean distance to each DTC point-cluster and selecting the closest DTC; single-cell results were compiled in the classification vector (bottom middle). The classification for UTC, in turn, was defined to be the mode of the classification vector. Bootstrapping was performed to determine the distribution of the mode frequency, which, in turn, was used to calculate the P-score for the classification of UTC (bottom left).


