
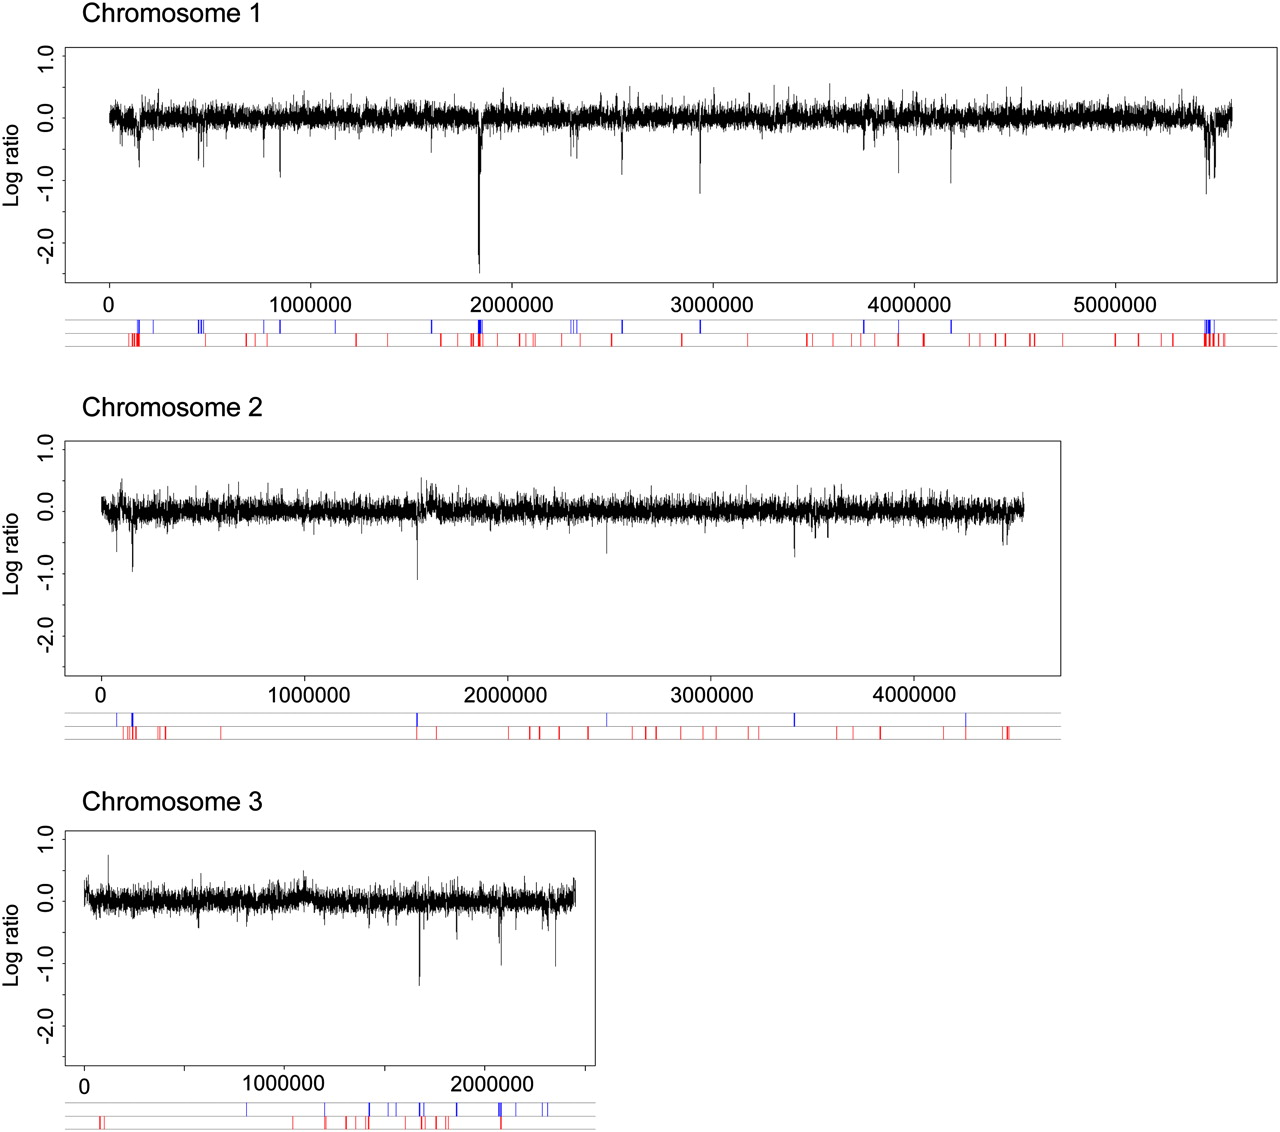
Figure 3.
Differences in the histone H3 occupancy over the entire genome, before and after nitrogen starvation. The genomic position in base pairs from the left end of each chromosome is shown on the x-axis and the H3 occupancy log2 ratio on the y-axis. Regions with a significant histone H3 depletion 20 min after nitrogen starvation are shown in blue at the bottom; up-regulated genes are shown in red.


