
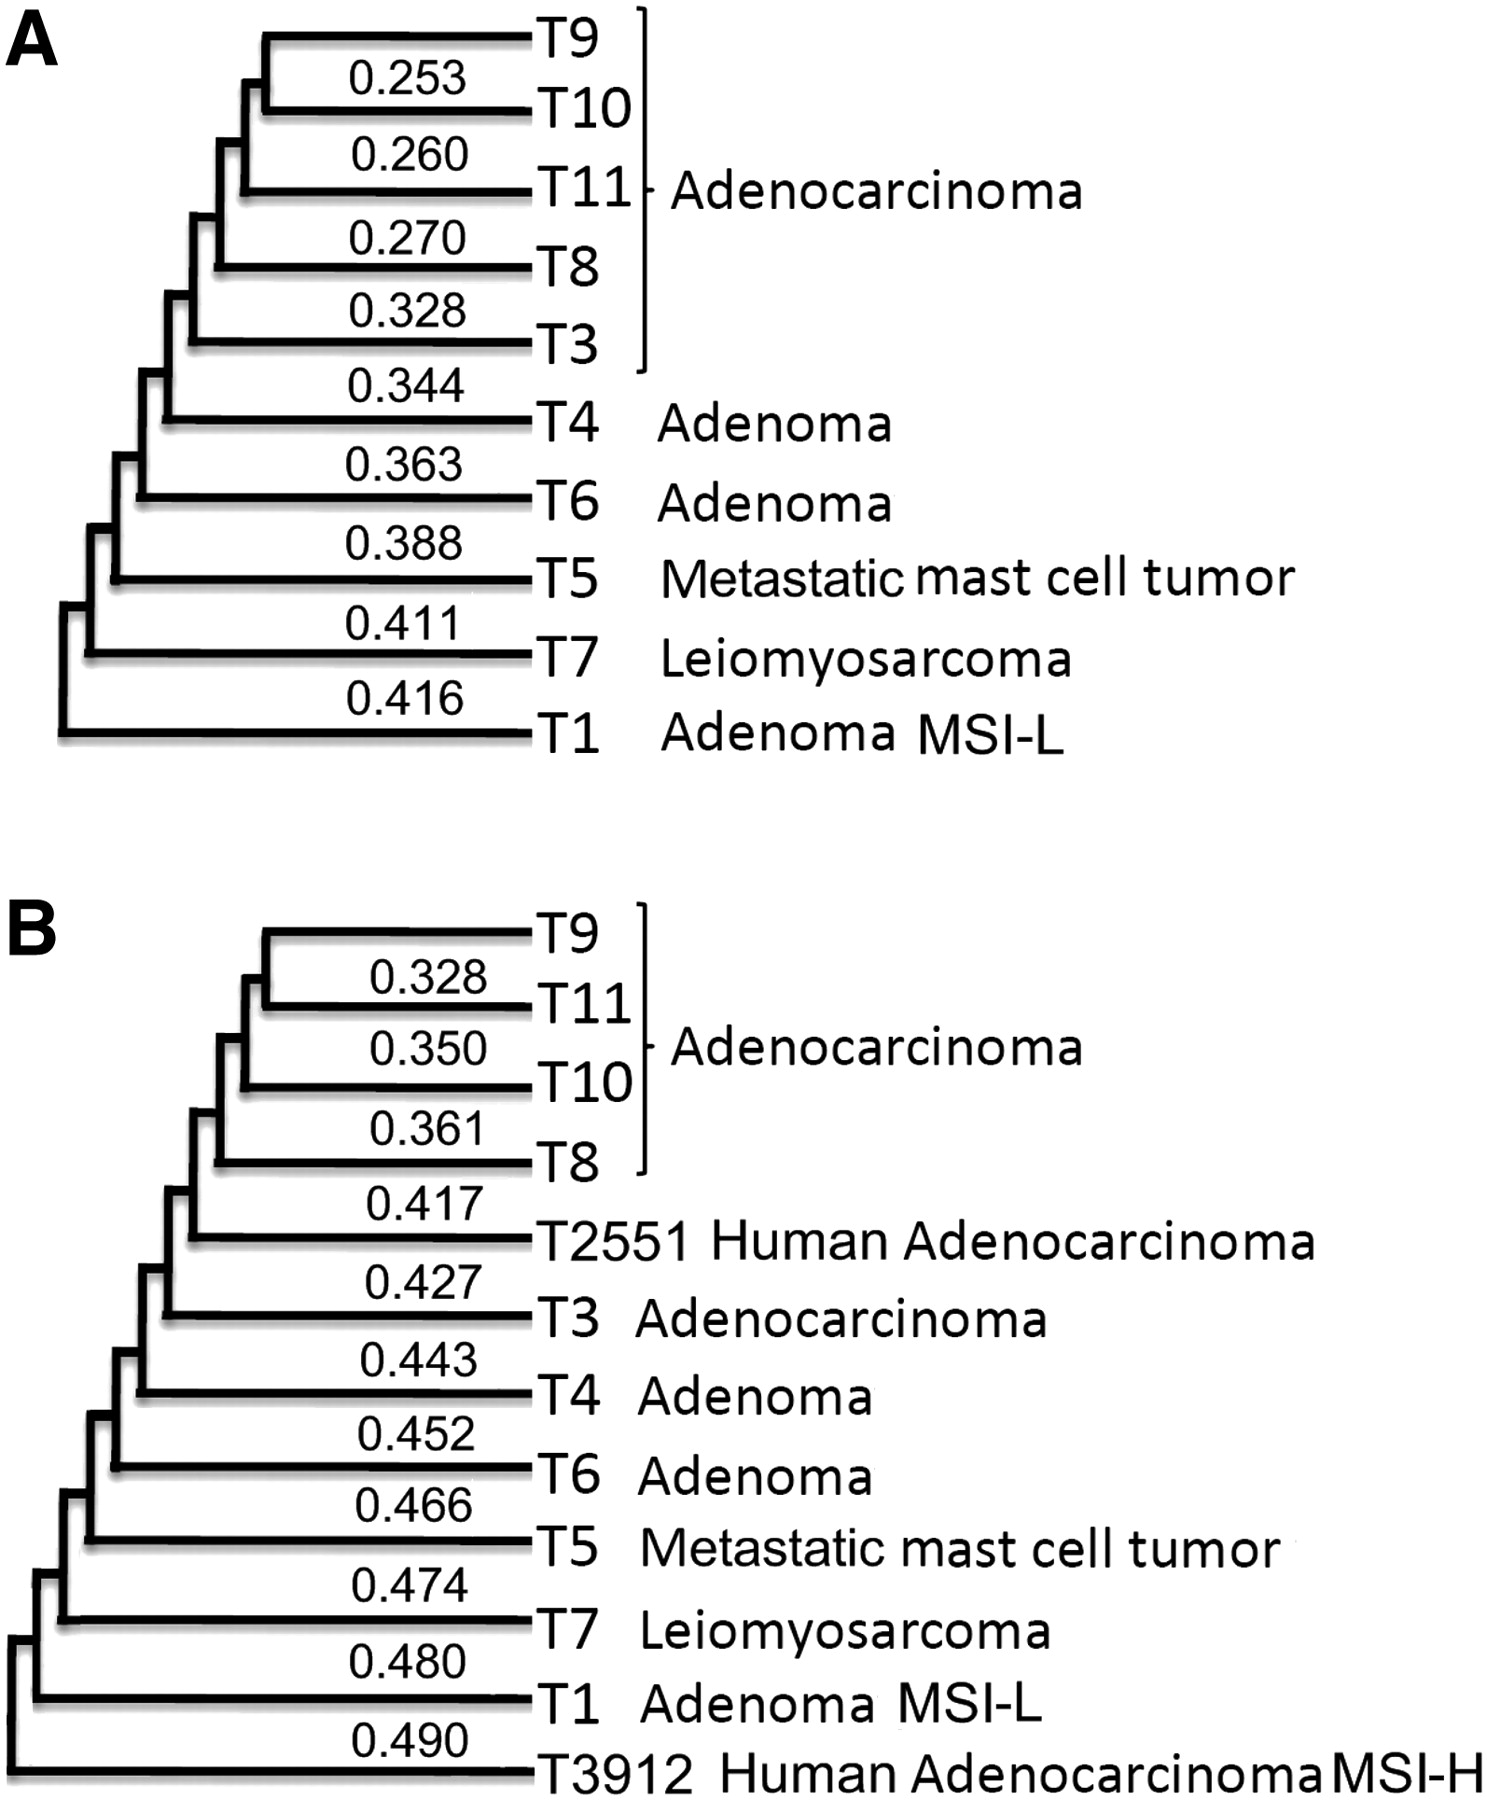
(A) Clustering of the dog tumors. The tree was constructed by MST or top-down clustering as described in the text (both strategies
yielded the same tree), with the sample information for each tumor shown on the right. The number for each branch represents the distance d(X, Y) between the two clusters X and Y involved, calculated by  , where dij is the distance between a tumor Ti of cluster X and a tumor Tj of cluster Y calculated as described in the text, and |X| and |Y| are the total number of tumors inside clusters X and Y, respectively. (B) Clustering of tumors from both humans and dogs. The tree was constructed as described above, using the overlapping information
of CNAs either identified on (for the human tumors T2551 and T3912) or mapped onto (for the dog tumors, see Fig. 3) the human
genome. MSI-L: MSI-low; MSI-H: MSI-high.
, where dij is the distance between a tumor Ti of cluster X and a tumor Tj of cluster Y calculated as described in the text, and |X| and |Y| are the total number of tumors inside clusters X and Y, respectively. (B) Clustering of tumors from both humans and dogs. The tree was constructed as described above, using the overlapping information
of CNAs either identified on (for the human tumors T2551 and T3912) or mapped onto (for the dog tumors, see Fig. 3) the human
genome. MSI-L: MSI-low; MSI-H: MSI-high.


