
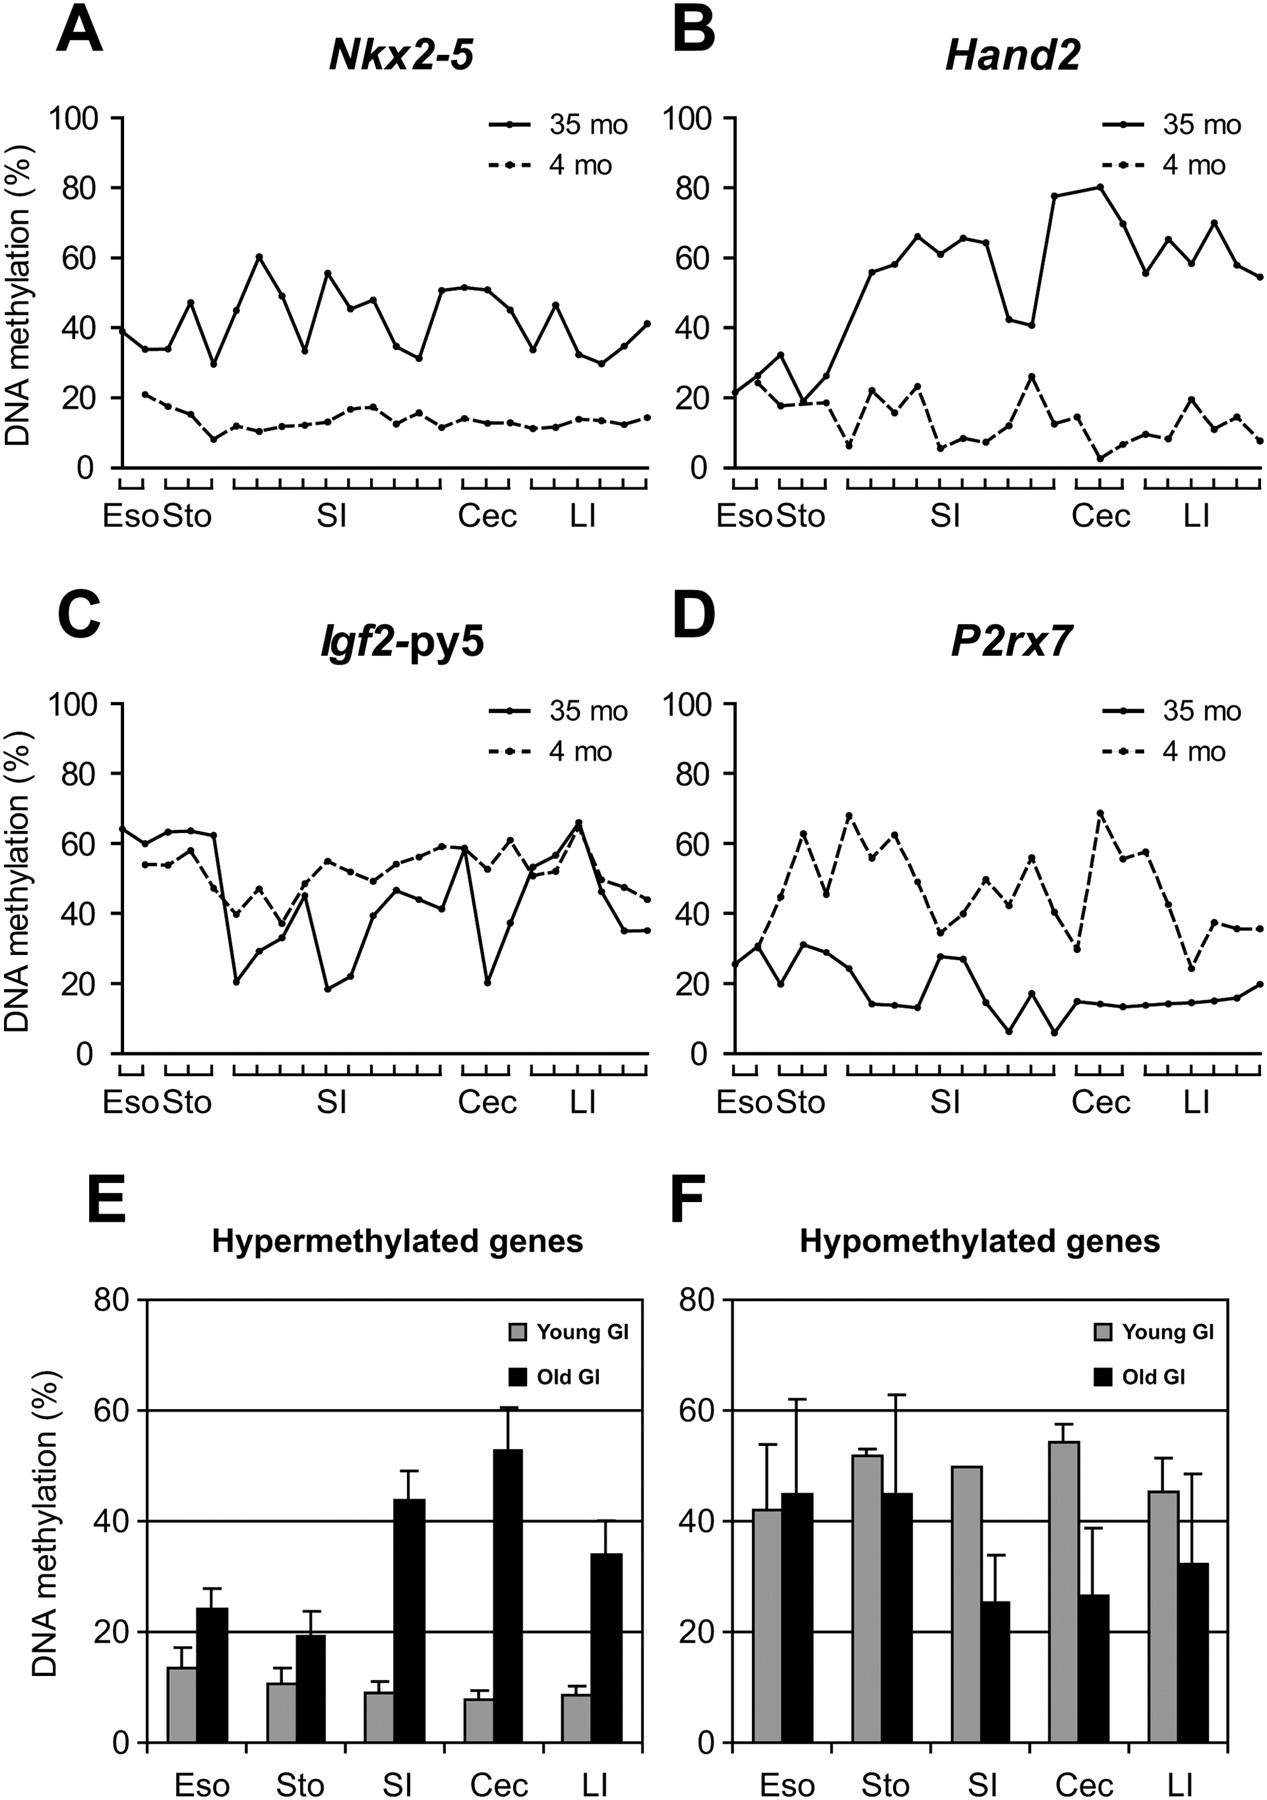
Figure 4.
Methylation profiles of young and aged gastrointestinal tract (esophagus, stomach, small intestine, cecum, and large intestine). (A–D) Methylation profiles of Nkx2-5, Hand2, Igf2-py5, and P2rx7, respectively. (X-axis) The percentage of methylation; (y-axis) regions analyzed in the GI tract from esophagus to large intestine; (dotted lines) young tissues (3 mo); (solid lines) aged tissues (35 mo). (E) Methylation profiles of hypermethylated genes with age. Average percentages of methylation of Hand2, Pgr, Nptx2, Prdm5, and Dok5. (F) Methylation profiles of hypomethylated genes with age. Average percentages of methylation of P2rx7 and Igf2-py5.


