
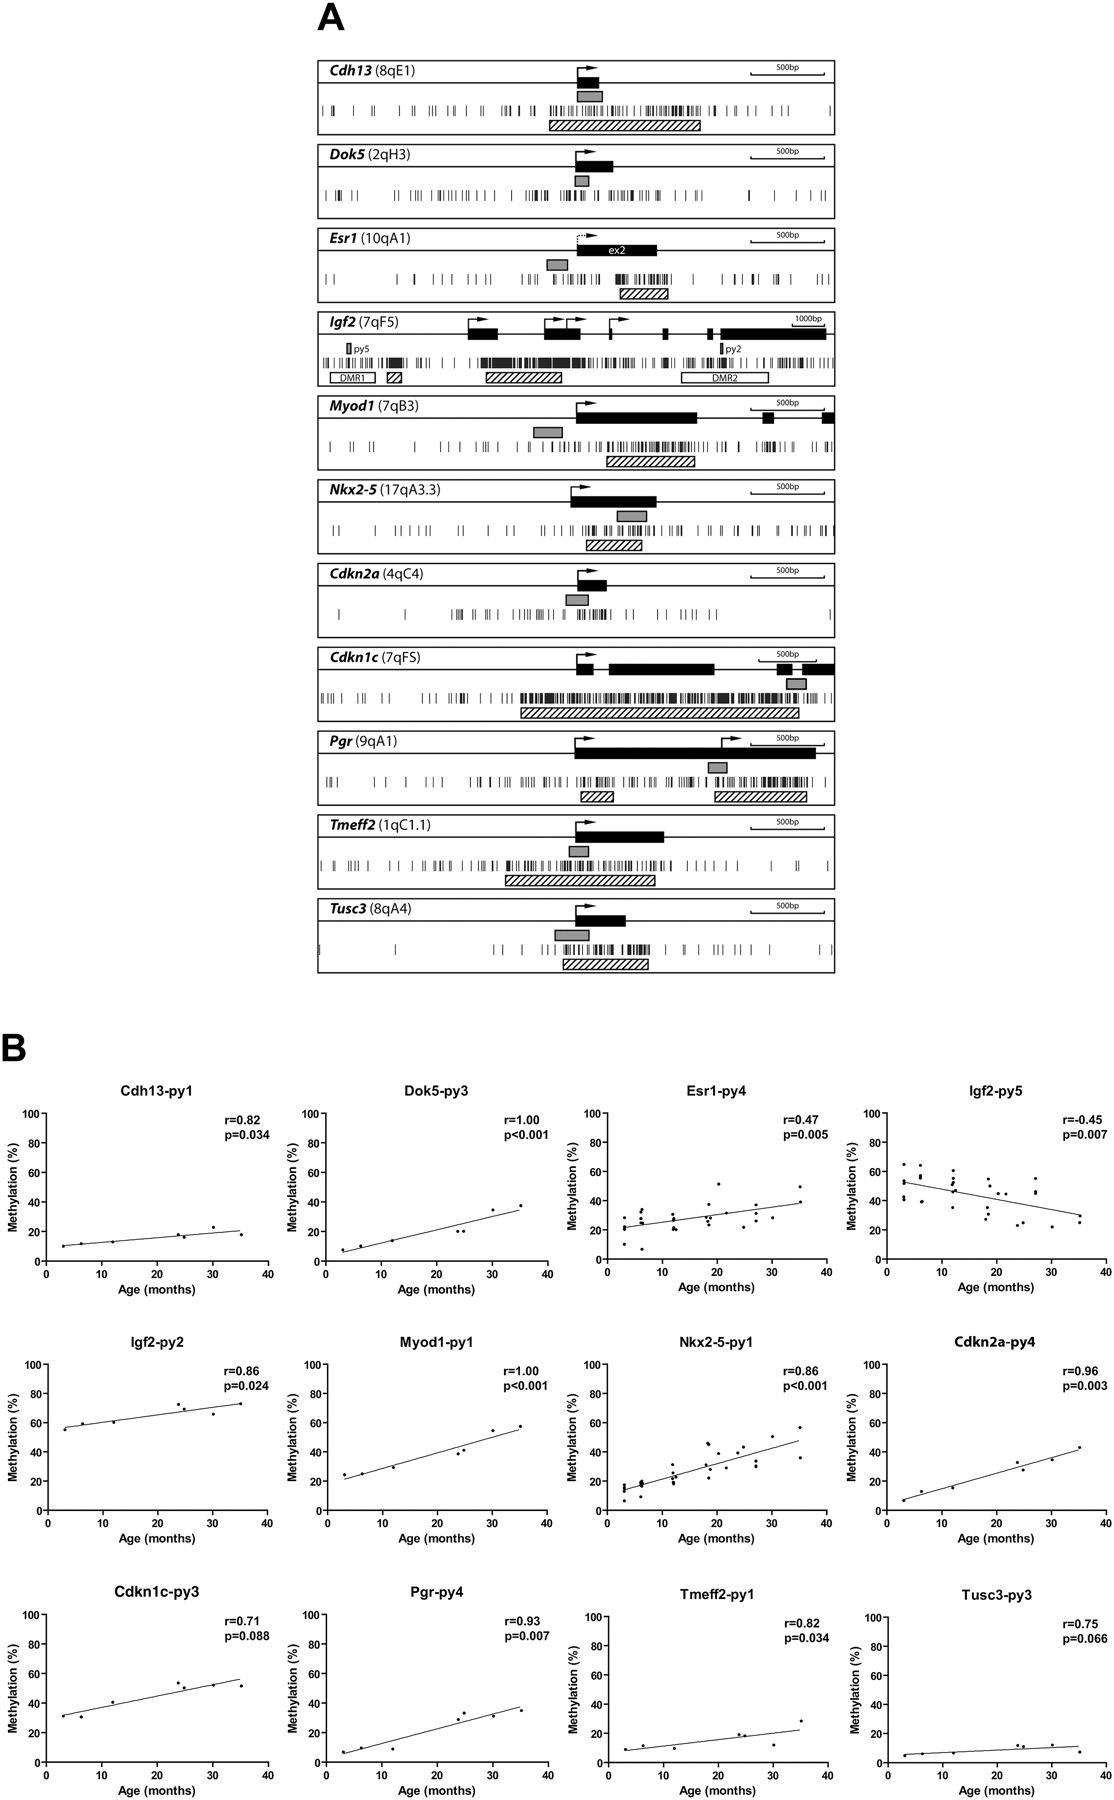
Methylation profiles by pyrosequencing analysis. (A) Gene structure and CpG sites analyzed. Maps represent 3.5 kb of sequence around CpG islands (hatched boxes) and exons (black boxes) of genes analyzed in this study. Short vertical bars represent CpG sites. Arrows point to transcriptional start sites. Gray boxes represent amplified regions for pyrosequencing (py). (B) Association of the percentages of methylated cytosines in the samples as obtained from pyrosequencing (y-axis) with age (x-axis) for 12 genes. The Spearman test was used to determine correlations, with significance set at P < 0.05. R represents a measure of the linear relationship between two variables, and varies from −1 to +1.


