
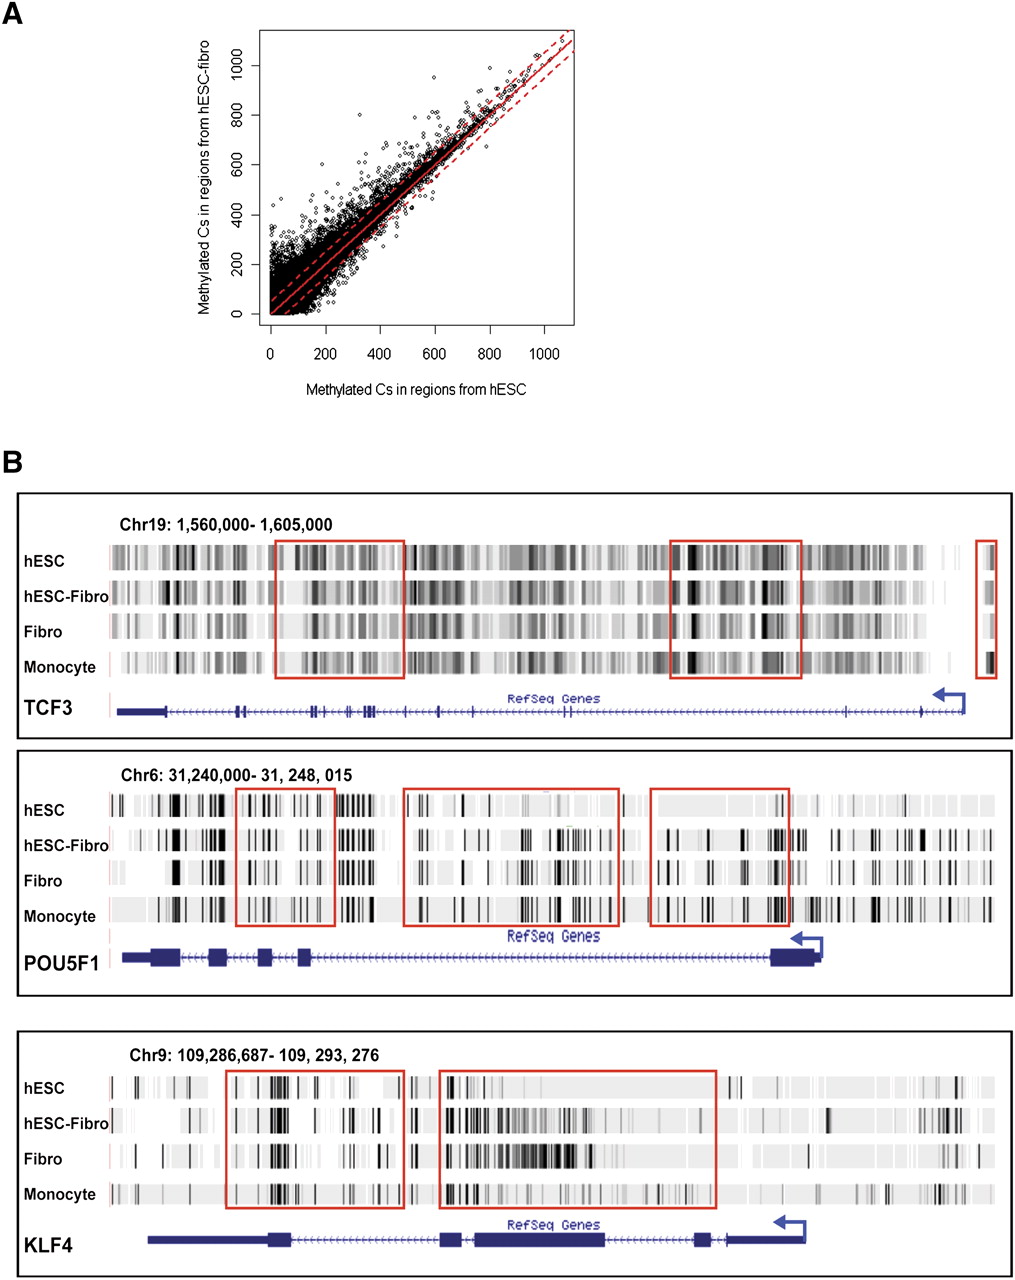
Figure 6.
Differentially methylated regions (DMRs) in hESCs and hESC-Fibros. (A) Scatterplot of methylation level in hESCs (x-axis) versus in hESC-Fibro (y-axis). The red line indicates the cutoff of 5 SDs. The distribution is very similar in the two cell types, with a correlation coefficient of 0.879. (B) Examples of DMRs found in the pluripotence-associated transcription factors TCF3, POU5F1, and KLF4.


