
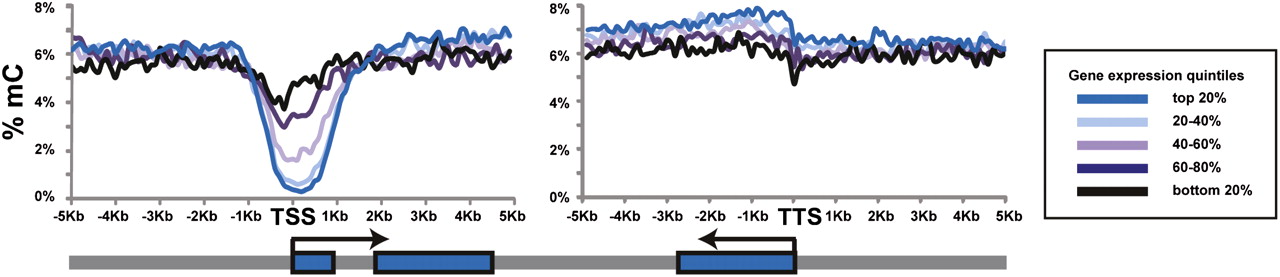
Figure 5.
Correlation of methylation profile with expression level in hESCs. The expression levels of genes in hESCs (from microarray analysis) were divided into five categories. The 20% most highly expressed genes exhibited the lowest methylation levels with the nadir of the hypomethylated “valley” centered at ±1 kb from their TSS. As the gene expression decreased, the valley became more shallow. Interestingly, the levels of methylation found in the gene bodies of the most highly expressed genes were slightly higher than in genes expressed at lower levels.


