
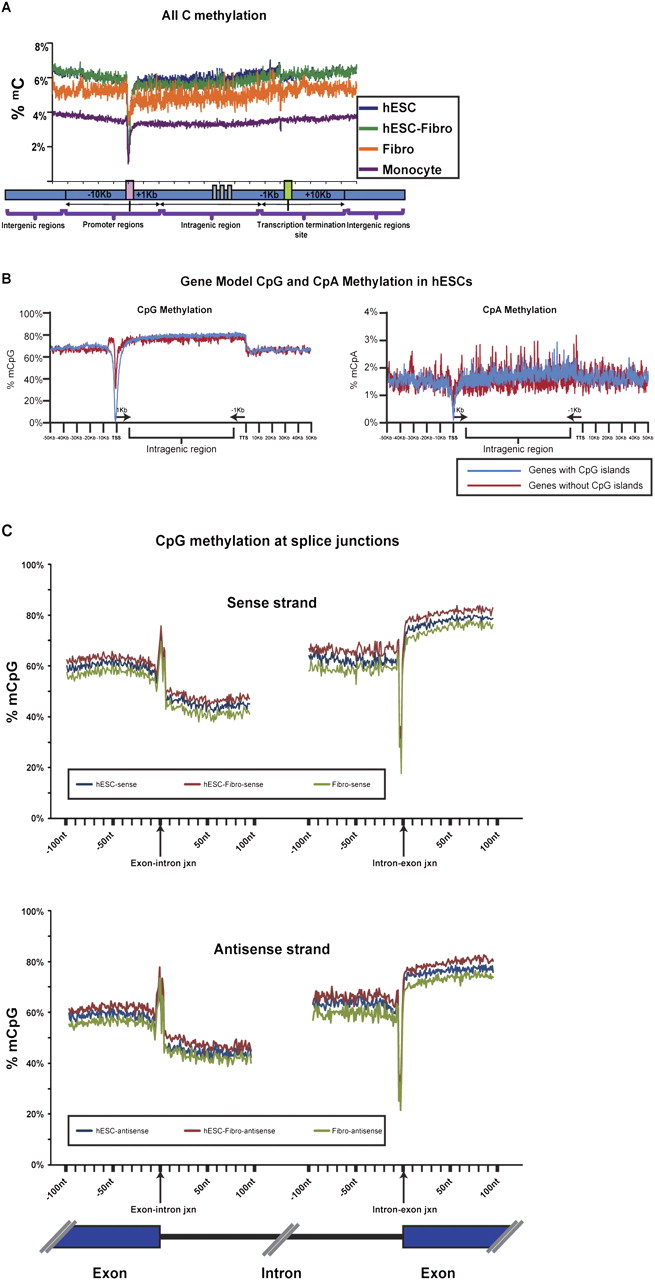
(A) Average distribution of DNA methylation mapped onto a gene model. Overall methylation levels at the TSS (transcription start site) region were lower in hESCs compared to the differentiated cell types. (B) The CpG and CpA methylation distribution surrounding genes with and without CpG islands (CpI), shown for hESCs. CpG and CpA methylation levels were lower at the TSS region in both genes with and genes without CpG islands at the promoter. However, the level of methylation was lower for genes with promoters containing CpG islands. Promoters without CpG islands showed a peak of CpG methylation ∼1.5–5.0 kb upstream of the TSS. Data for all cell types are shown in Supplemental Figure 7. (C) CpG methylation across splice junctions. The percent of mCpG across a 100-bp window spanning the exon/intron junctions was mapped. Both sense (upper panel) and antisense (lower panel) strands showed a sharp spike in CpG methylation at the exon/intron junction, followed by a steep decrease in methylation that gradually increases with proximity to the next exon. Another sharp spike, of decreased methylation in this case, is followed by a steep rise in methylation as the next exon begins.


