
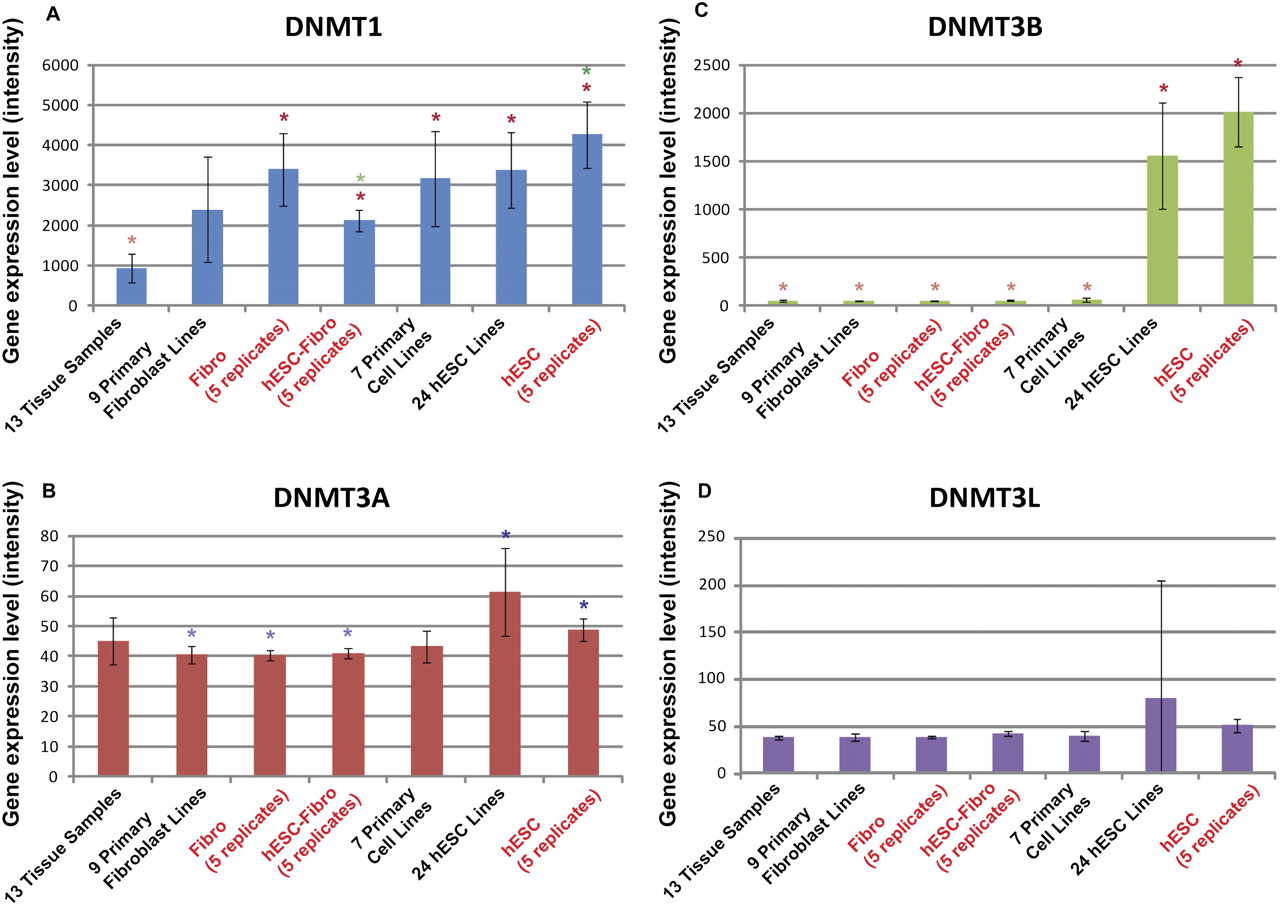
DNMT1, DNMT3A, DNMT3B, and DNMT3L gene expression in the hESC, hESC-Fibro, and Fibro cell types in the context of a large collection of tissue, primary cell, and hESC cell samples. Gene expression was extracted from microarray data (Muller et al. 2008). Gene expression levels measured as quantiles-normalized signal intensity are indicated on the y-axis. Error bars, SD. Data from five biological replicates of the cell lines used for bisulfite sequencing (hESC, hESC-Fibro, and Fibro) have red labels. Significant differences in expression between cell types are indicated by sets of colored asterisks; the cell types with higher expression are marked with darker asterisks, and the cell types with lower expression are marked with lighter asterisks of the same color (e.g., in A, DNMT1 expression is significantly lower in the Tissue group compared to all of the other groups with the exception of the Primary Fibroblast group).


