
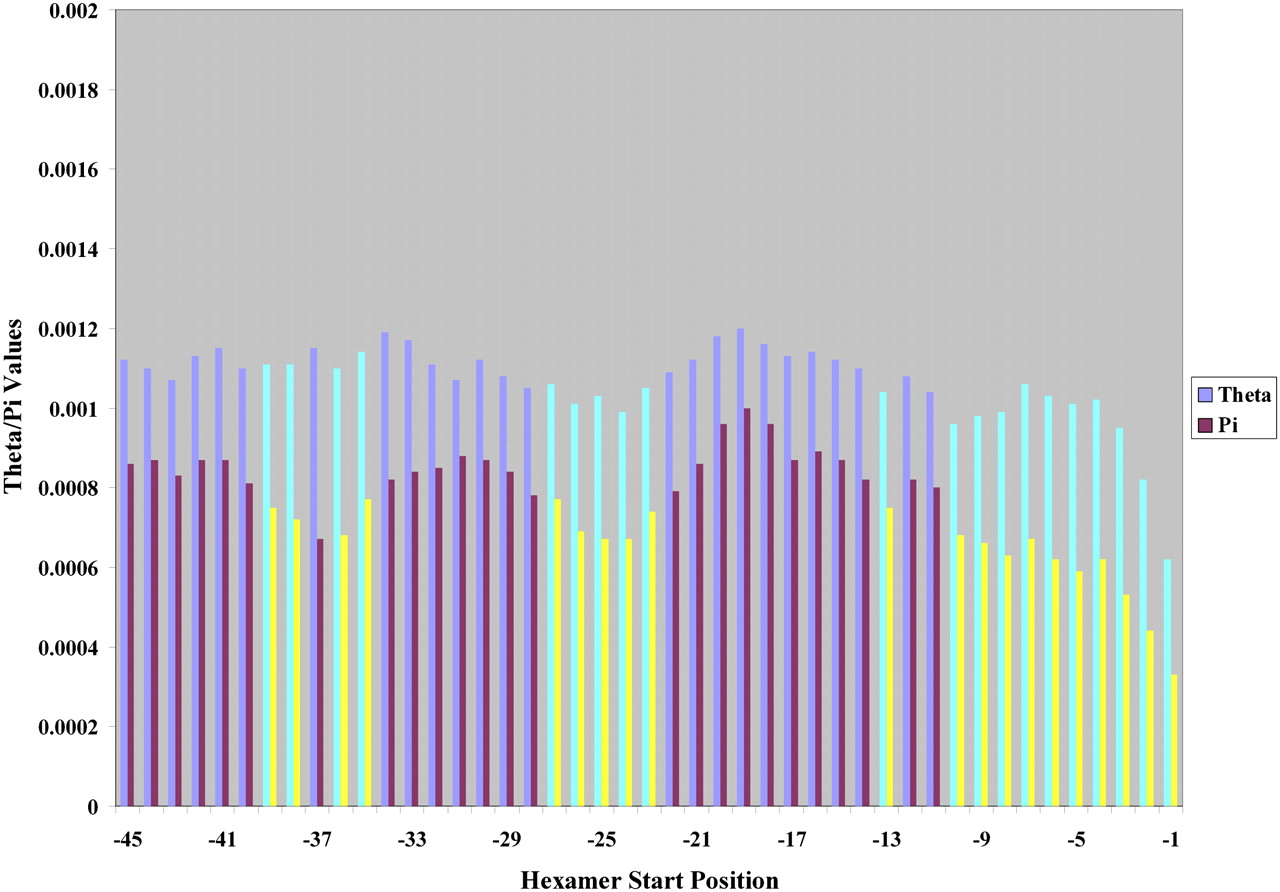
Figure 3.
Distribution of human polymorphism for hexamers in the 3′ splice site using the combined data sets. θ and π values for each hexamer starting at the shown nucleotide positions of the 3′ splice site. Brightly colored bars are sites where both θ (cyan) and π (yellow) are statistically significant.


