
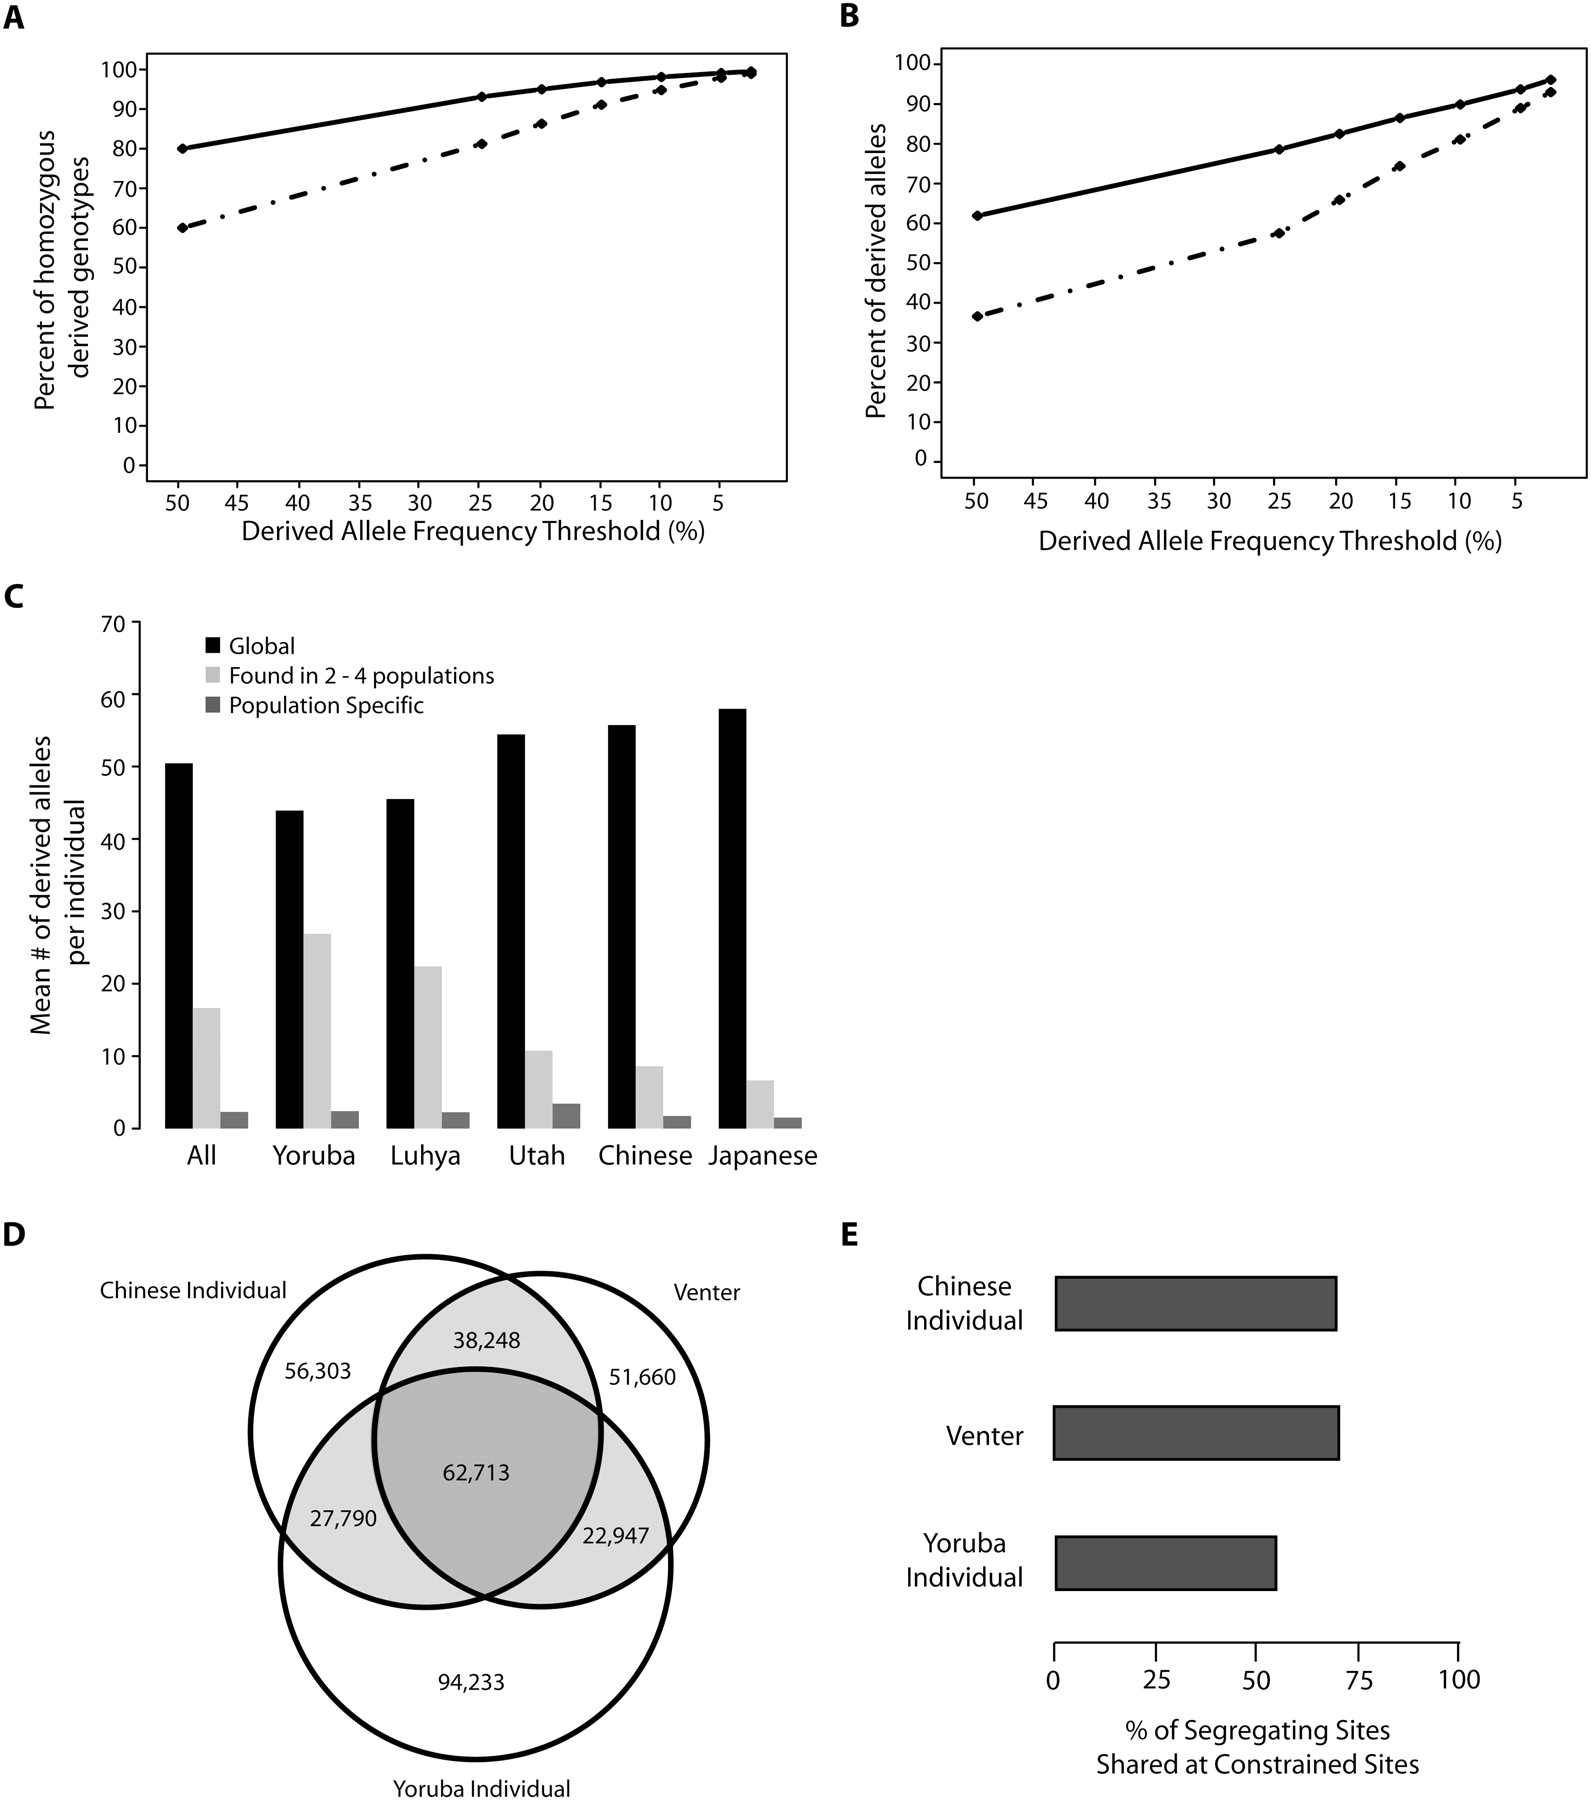
Properties of derived alleles at constrained sites. (A) Percentage of sites homozygous for derived alleles, where the derived alleles are of a frequency above the threshold indicated along the x-axis, per individual, at all sites (solid line) or at constrained sites only (broken lines). (B) Percentage of derived alleles of a frequency above the threshold indicated along the x-axis, per individual, at all sites (solid line) or at constrained sites only (broken lines). (C) Mean number of sites per individual that bear derived alleles found in all five populations (global SNVs), are found only in the indicated population (population specific), or are shared between two to four populations. (D) Number of segregating sites in each individual at highly constrained (RS > 2) sites that are shared between individuals or are private to each individual. (E) Percentage of segregating sites at constrained (RS > 2) sites in each individual that are shared with at least one of the other individuals.


