
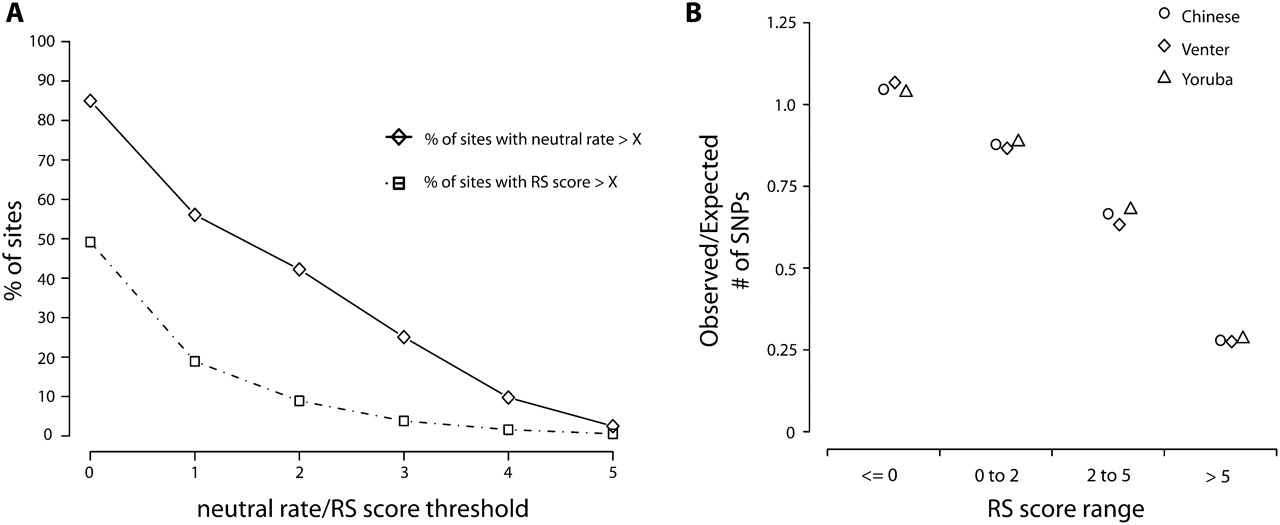
Figure 2.
Variation and evolutionary constraint in three personal genomes. (A) Coverage of the human genome by mammalian alignment depth (solid line) and level of constraint (broken line). (B) Ratio of the number of SNVs observed in the three individual genomes at sites within the given RS score range to the number expected, given the distribution of RS scores across the human genome.


