
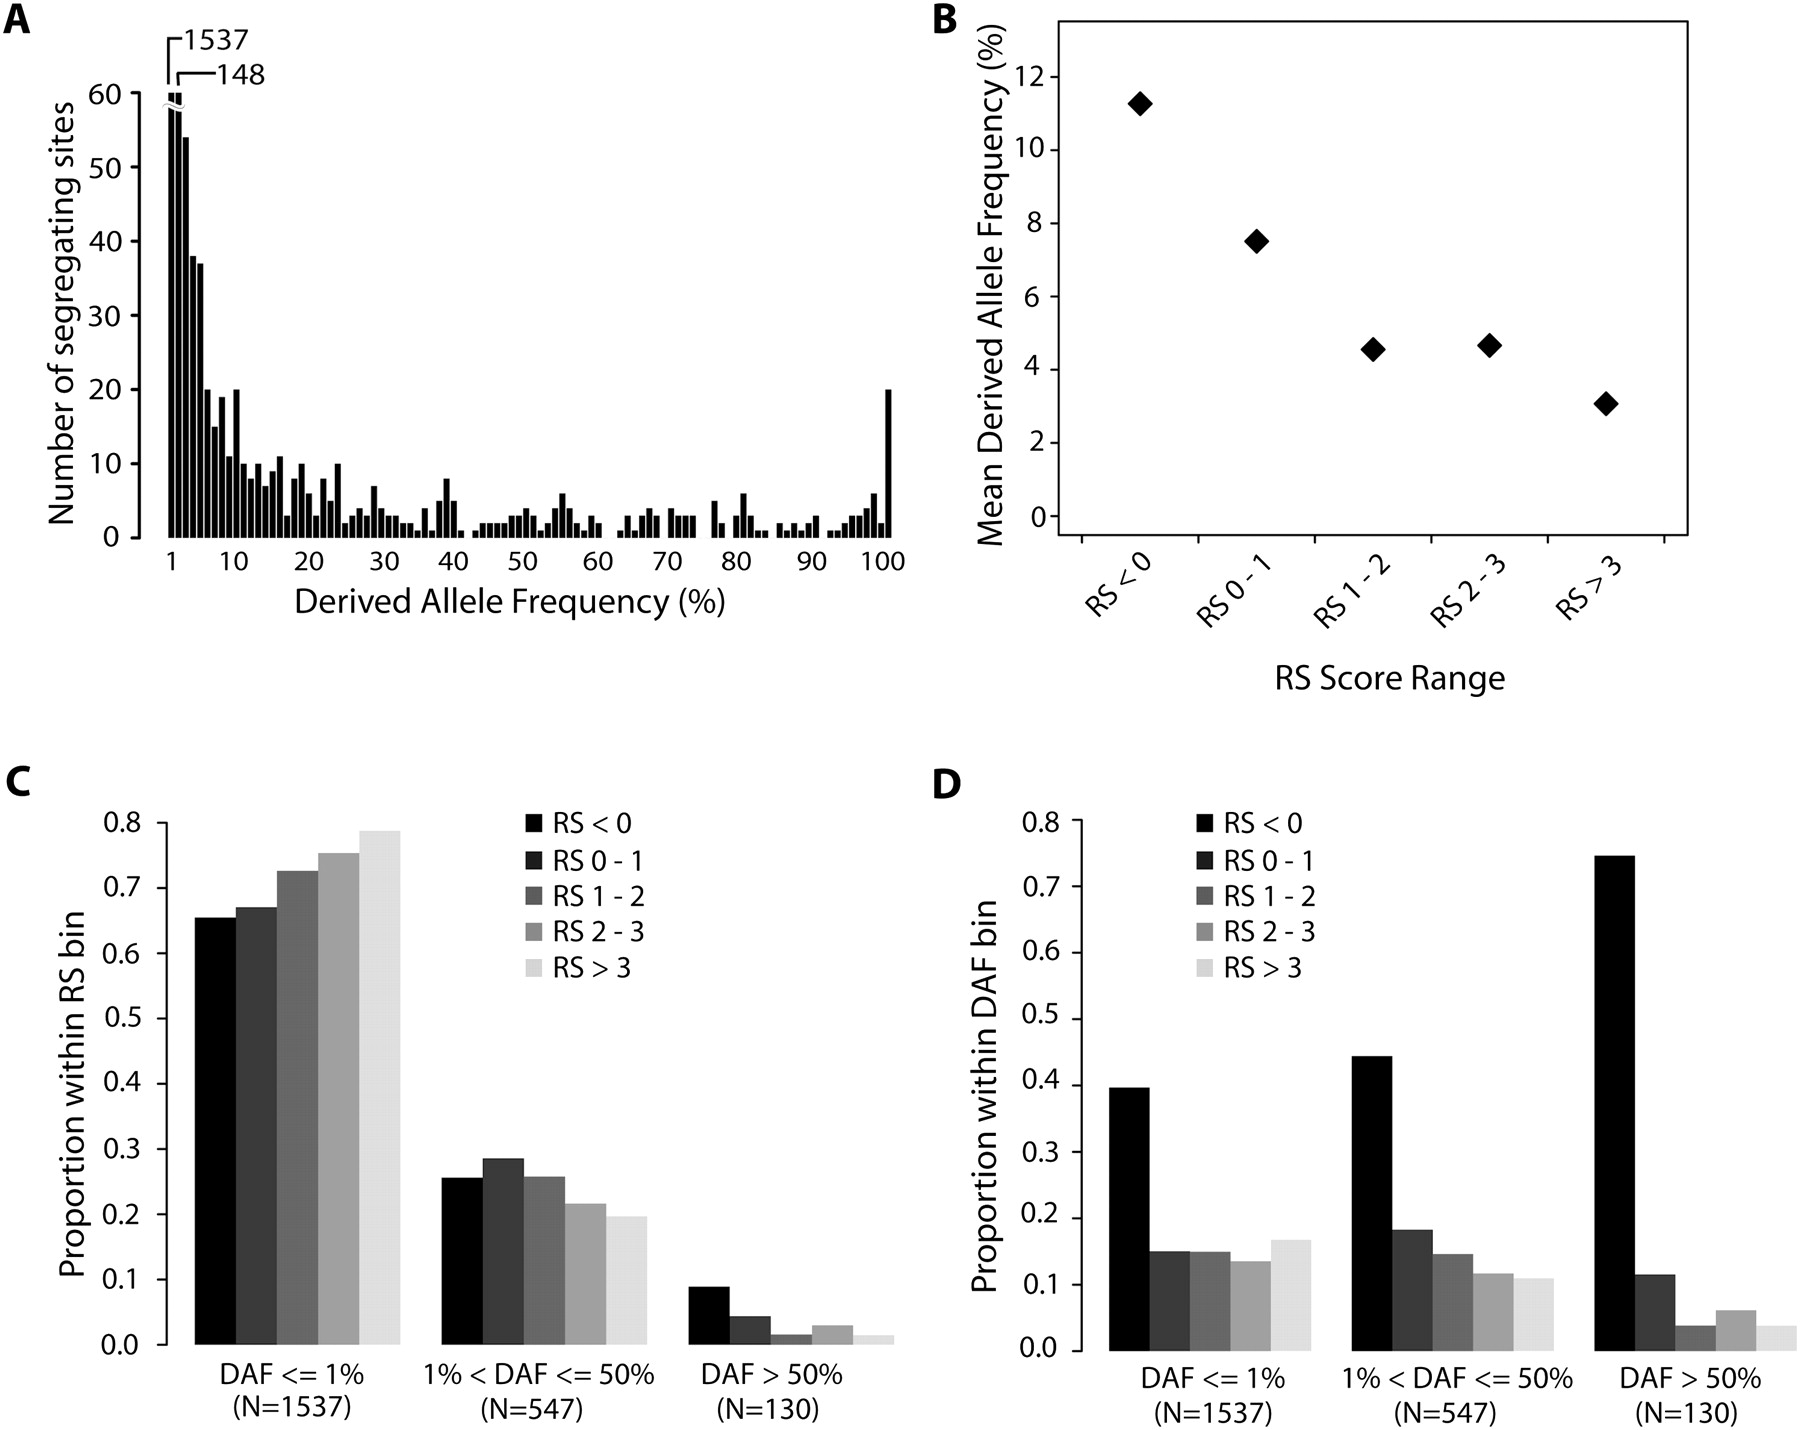
Derived allele frequency (DAF) compared with evolutionary constraint. (A) DAF spectrum of all SNVs. Each category is one percentile DAF. Note the much higher number of SNVs with 0%–1% and 1%–2% DAF compared with the rest of the data. (B) Mean DAF as a function of RS score. Sites with RS > 0 are binned by increasing level of constraint. (C) Proportion of sites of the indicated DAF within each of five RS bins. Bars of each RS bin add up to 1 but are organized by DAF to facilitate visual comparison between the RS bins. The greater the RS of a site, the rarer is its derived allele. (D) Proportion of sites within the indicated RS bins at sites of rare, intermediate to common, and very common DAF. The greater the DAF, the more SNVs avoid constrained sites.


