
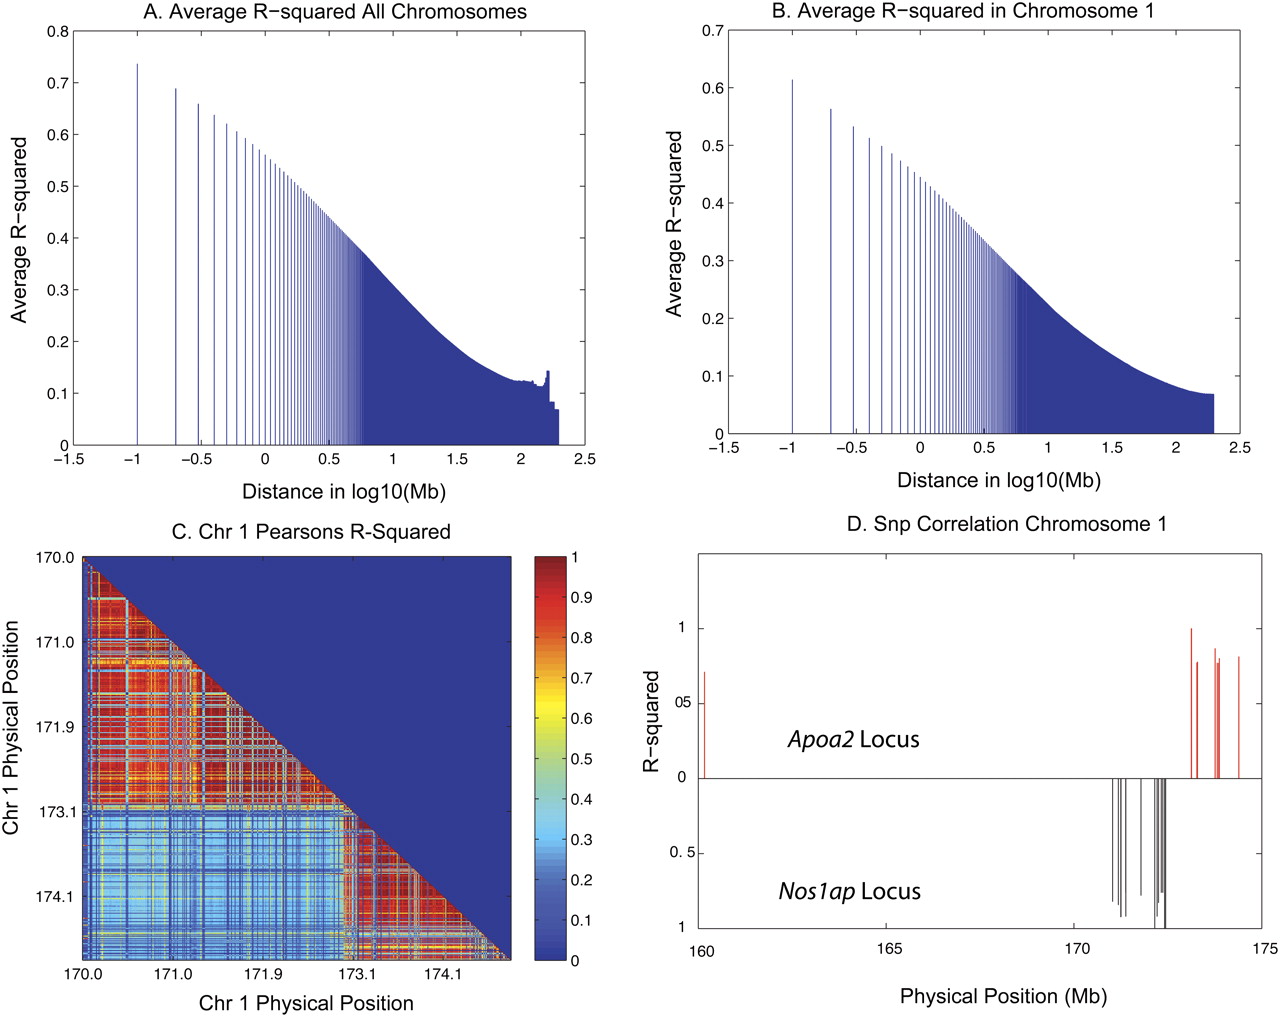
Figure 5.
Linkage disequilibrium in the HMDP. The average r2 for marker pairs was calculated per chromosome and the average of 20 chromosomes is presented here. (A) Average of 20 chromosomes. (B) Average r2 for chromosome 1. The average correlation for markers 100 kb apart is r = 0.7, and for markers 1 Mb apart is r2 = 0.5 (C) Linkage disequilibrium blocks on distal chromosome 1. (D) Long-range LD patterns in the HMDP for these peak SNPs at 172.4 Mb, within coordinates of the Nos1ap gene, and 173.1, 30 kb upstream of the Apoa2 transcription start site on chromosome 1.


