
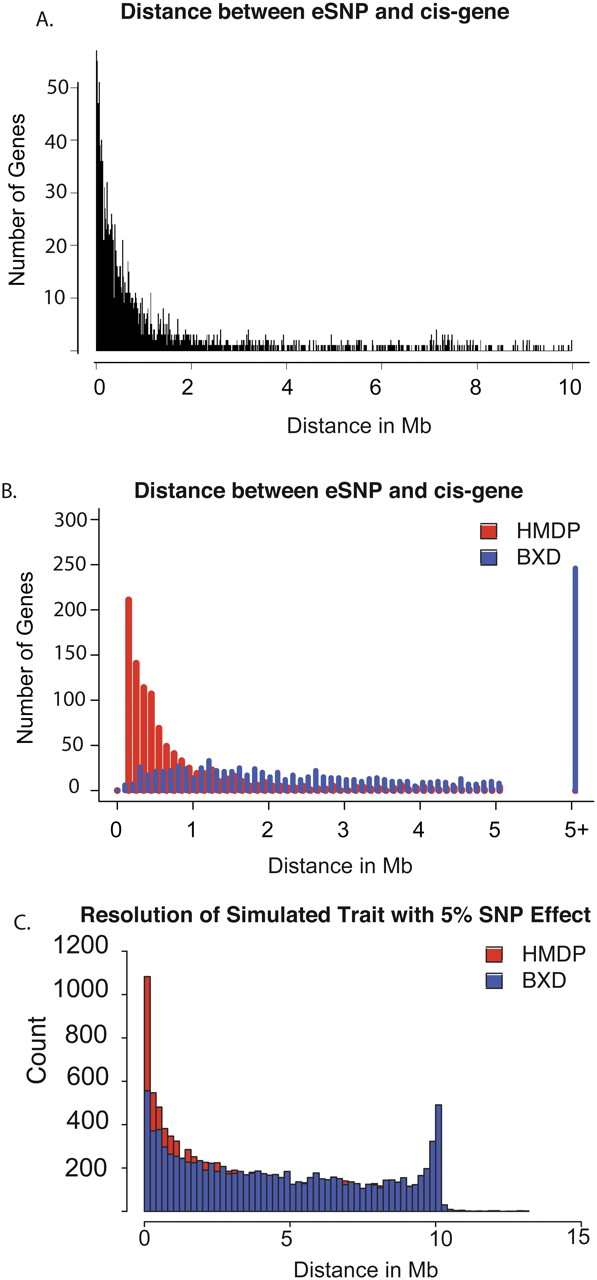
Figure 3.
Expression traits demonstrate high resolution of HMDP. (A) Distance between peak cis-eQTL and the transcription start site of the corresponding gene in the HMDP. The majority of cis-eQTL map within 500 kb of the transcription start site of the corresponding gene. (B) Comparison of resolution in the full HMDP (red bars) to BXD recombinant inbred panel (blue bars) showing 1000 cis-eQTL in both populations. (C) Simulated resolution of a SNP with 5% effect in the HMDP (red bars) and BXD recombinant inbred panel (blue bars).


