
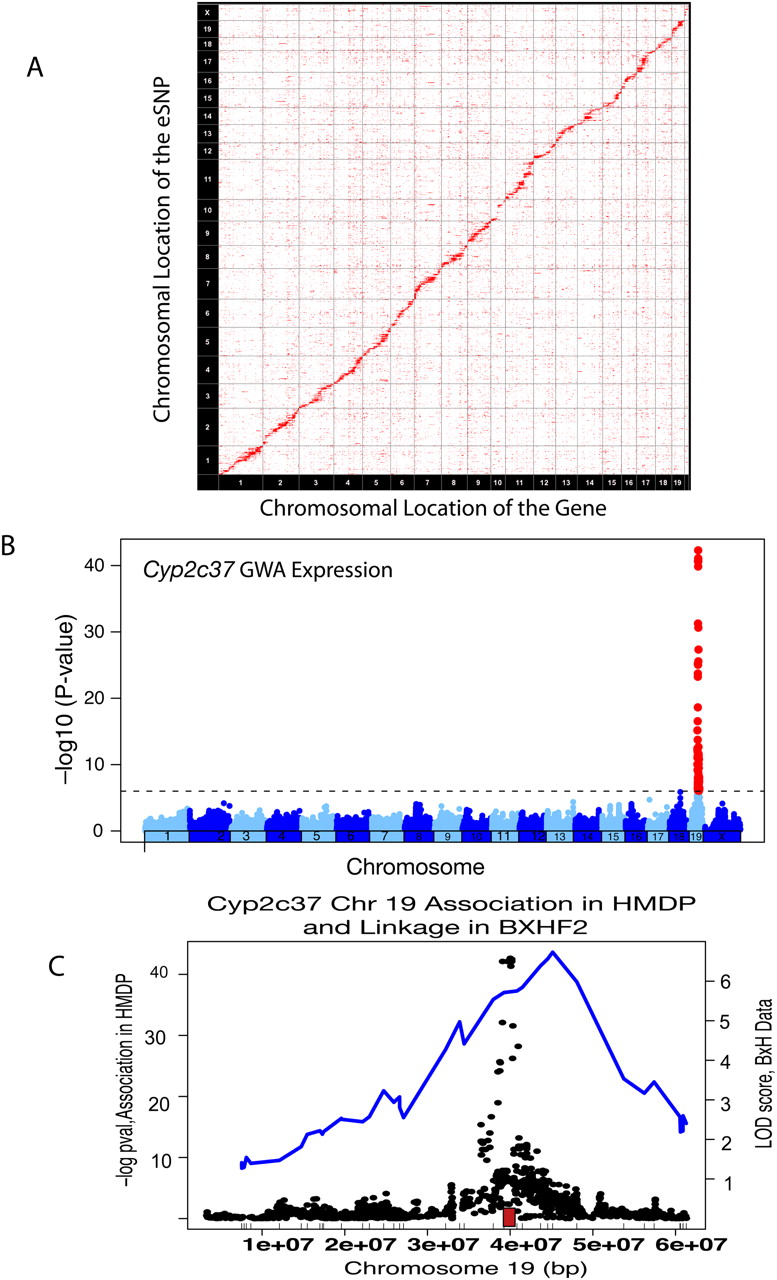
Expression SNPs from HMDP. (A) Transcript levels in liver of HMDP mice were profiled and significant associations are plotted according to chromosomal position (x-axis) versus the location of the structural gene (y-axis). The strong diagonal line represents cis-eQTL, whereas the remainder are trans-eQTL signals. (B) Genome-wide association results in the HMDP demonstrating a strong association for Cyp2c37 transcript levels in liver on chromosome 19. (C) Chromosome 19 specifically, with an overlay between the linkage results from the BXHApoe−/− F2 cross and the association from the HMDP panel for the Cyp2c37 cis-eQTL on chromosome 19. (Red box) The location of Cyp2c37. The tick marks on the x-axis are the location of the chromosome 19 markers used in the BXHApoe−/− F2 intercross.


