
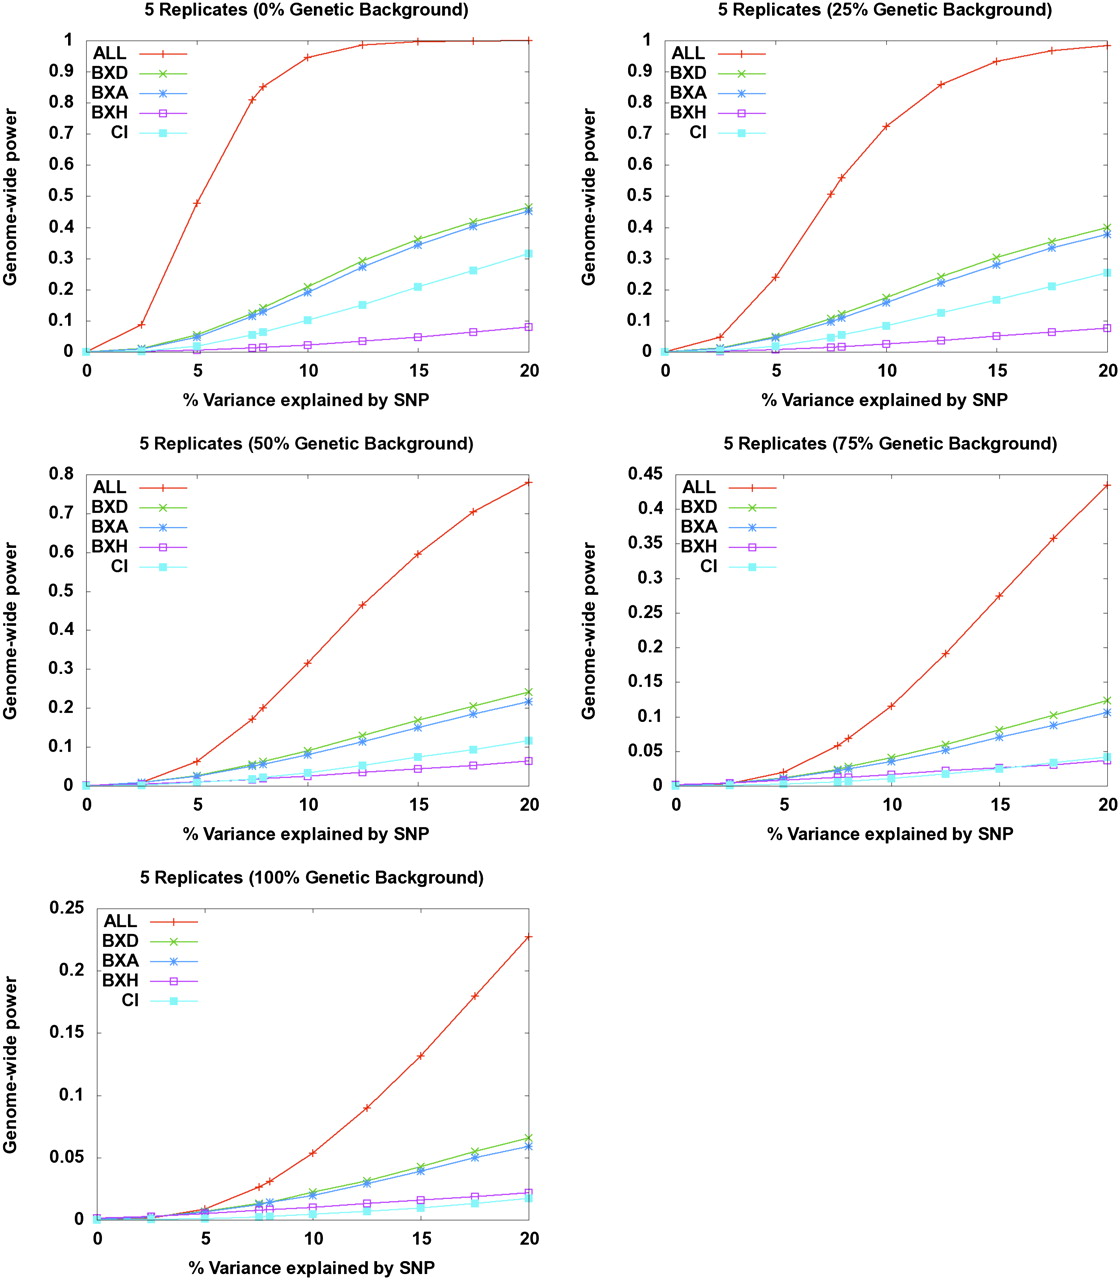
Figure 1.
Power calculations. We estimated the power for the 29 inbred strains, the individual RI panels (BXD, AXB/BXA, and BXH) and the combined HMDP. Simulations assume five replicates per strain. The x-axis indicates increasing effect size of SNP, and the y-axis is estimated power. Each panel represents simulations performed under different scenarios in which the genetic background (or population structure effect) accounts for an increasing proportion of the total variance of the phenotype.


