
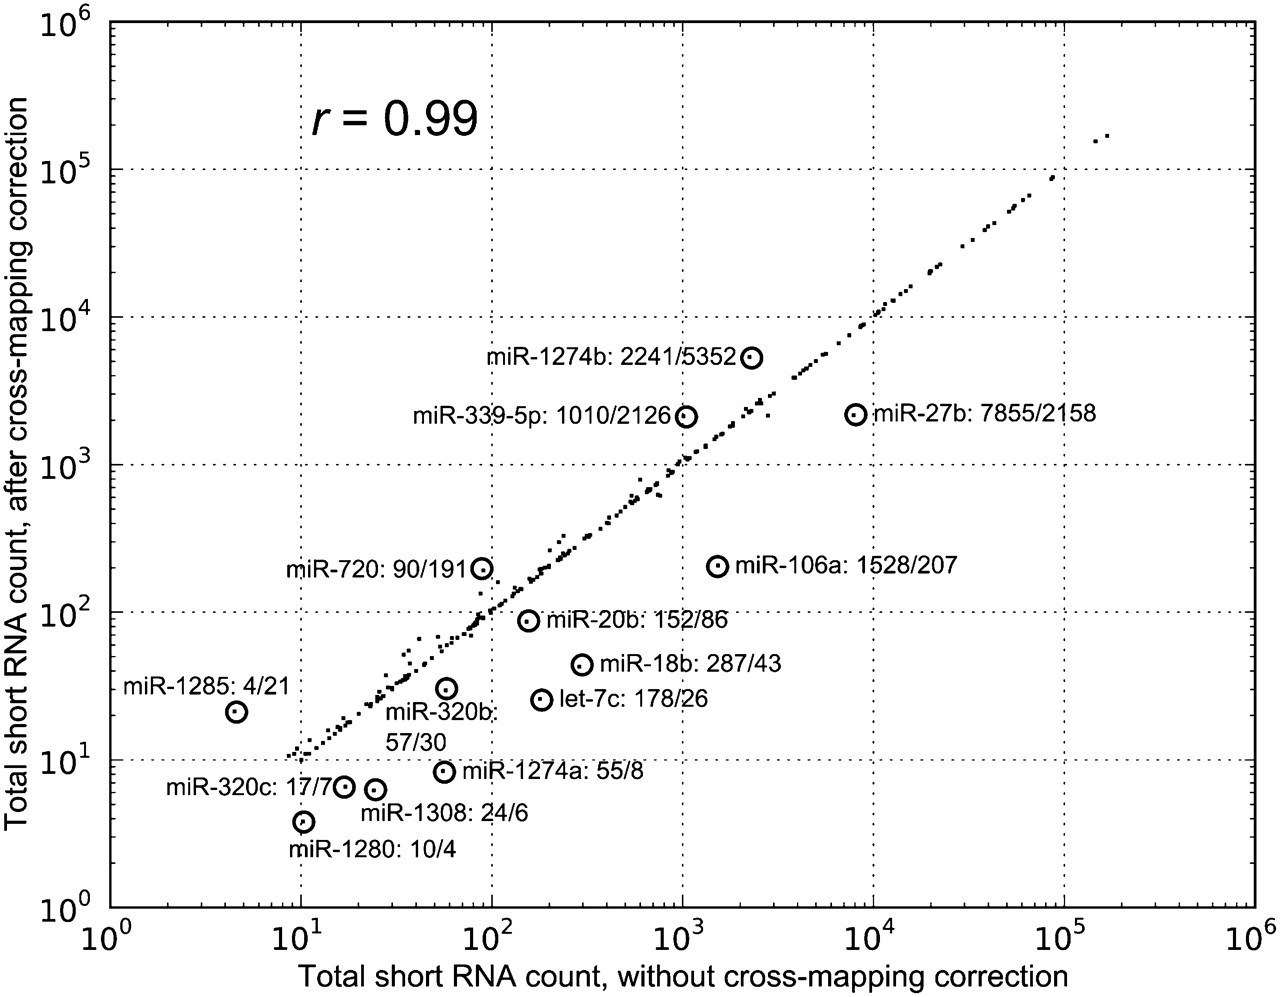
Figure 5.
Comparison of miRNA expression before and after cross-mapping correction. This scatter plot shows the expression of miRNAs before and after correcting for cross-mapping. With a Spearman correlation coefficient of 0.99, the cross-mapping correction has a minor effect on the estimated expression of most miRNAs. However, for 14 miRNAs the relative difference between the estimated expression with and without the cross-mapping correction was larger than 50%. These miRNAs are circled and shown together with their short RNA counts before and after the cross-mapping correction.


