
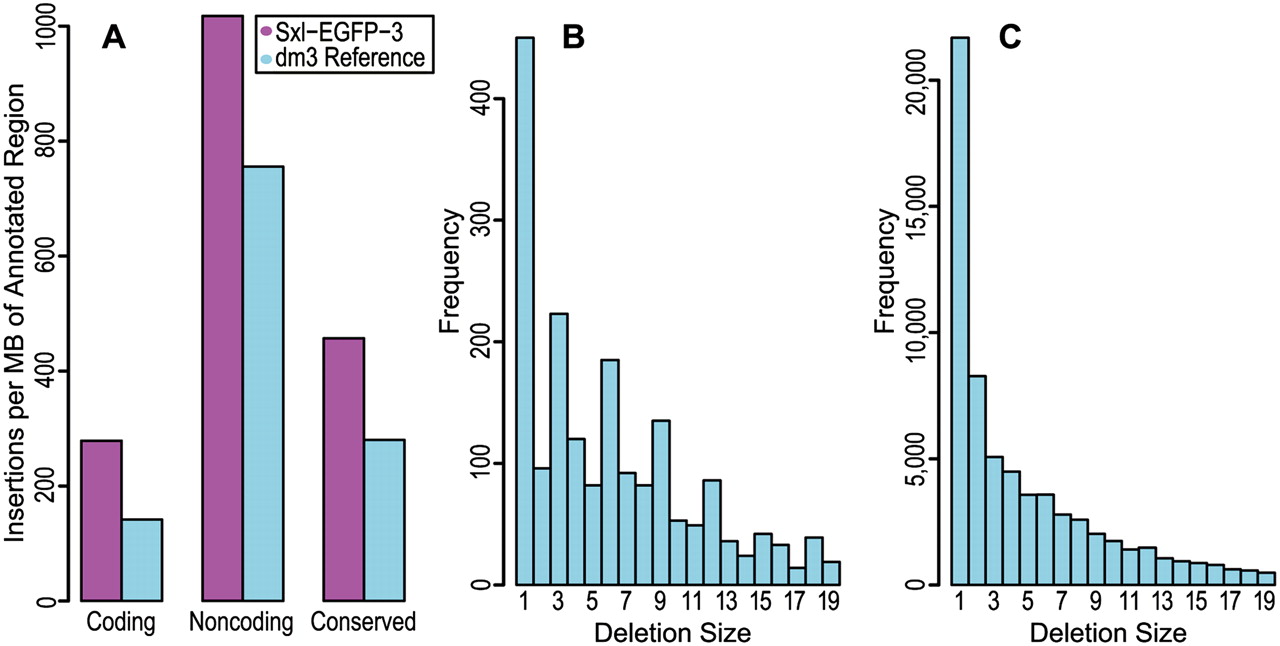
Depicted is a summary of indel events from comparison of the dm3 reference genome to the genome of our D. melanogaster individual. FlyBase annotations of the dm3 reference were used to determine the location of each indel event. (A) The number of insertions (magenta) and deletions (cyan) with respect to our fly are shown. The results are normalized by the megabases of sequence in each annotated track. (B) The distribution of deletion sizes is shown for regions annotated as coding sequence. An enrichment of deletion sizes that are multiples of three is visible, in addition to the underlying exponential decay visible in the deletion size distribution for regions annotated as noncoding (C).


