
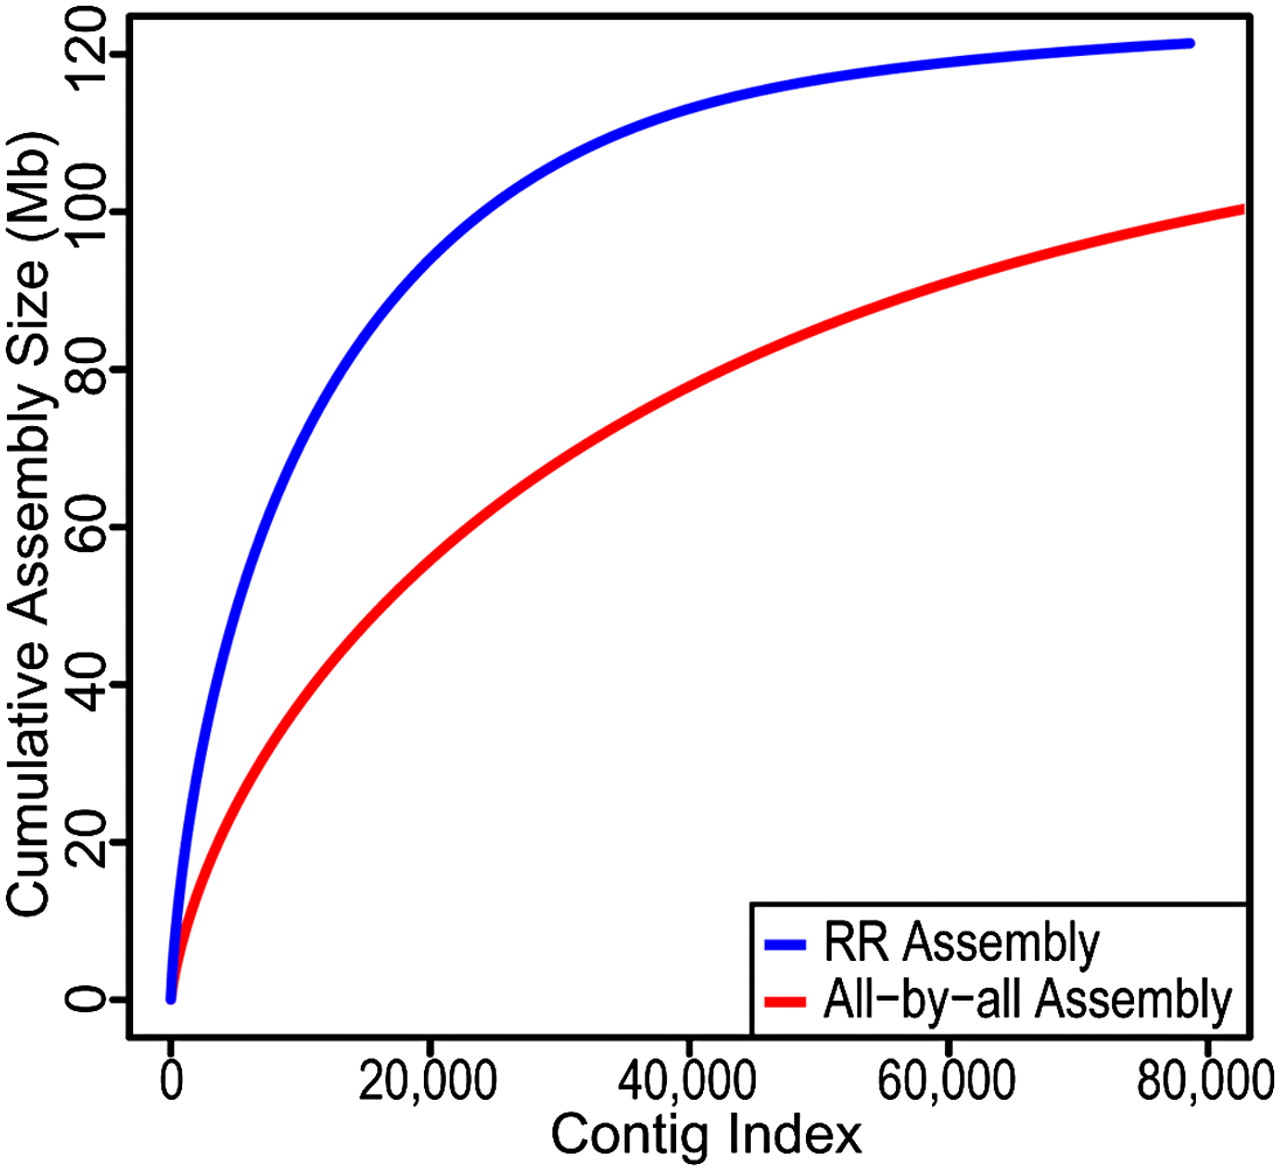
Figure 6.
Contigs created by the RR approach were compared with those generated by the all-by-all WGS approach. The contigs were ordered by decreasing size. The figure depicts the increase in cumulative assembly size by adding successive contigs from each sorted list. The assembly size increases with fewer contigs for the RR approach than the all-by-all approach.


