
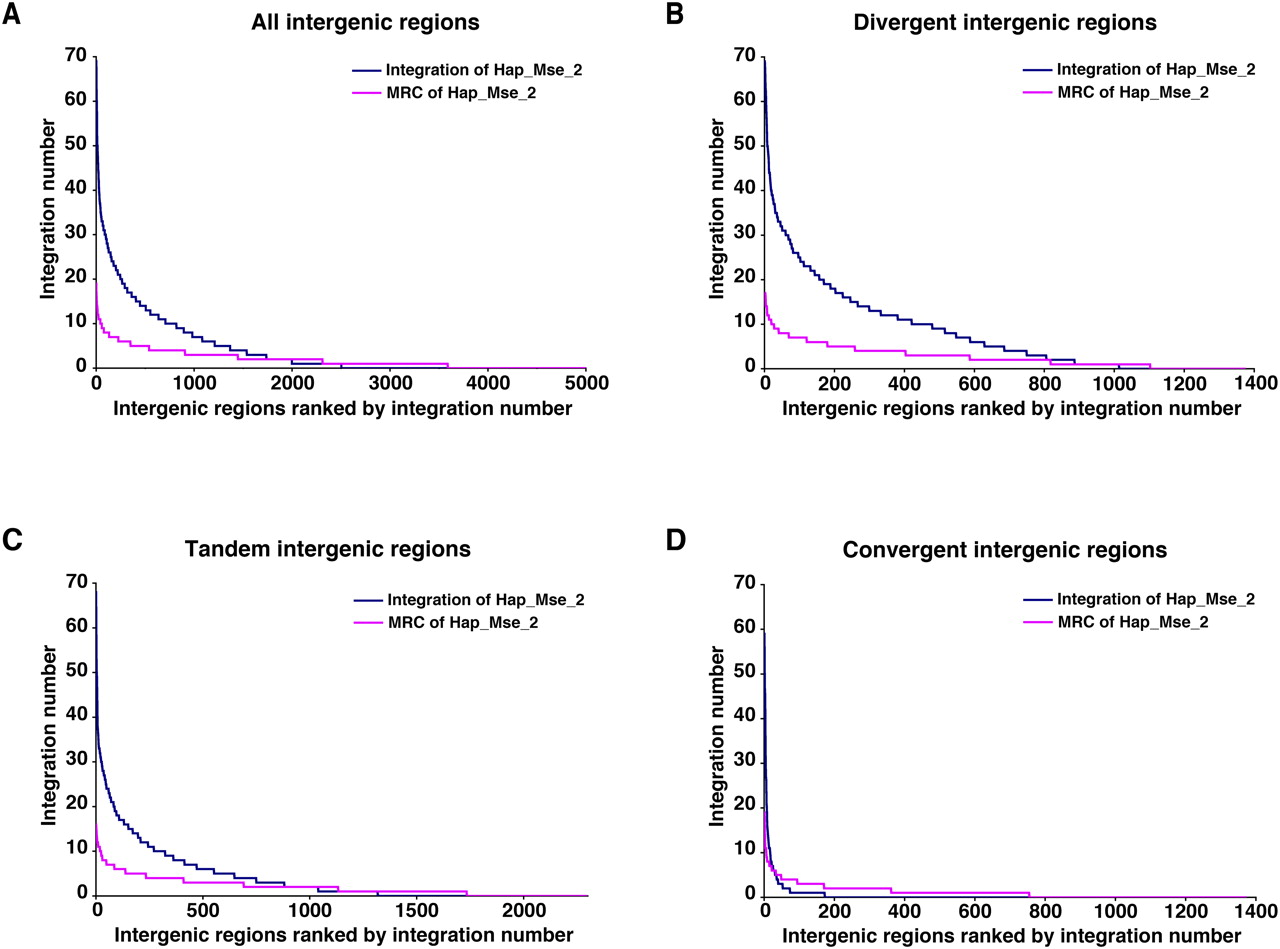
The ranking of intergenic regions based on their number of insertions detected in the Hap_Mse_2 experiment. (A) All intergenic regions of S. pombe were plotted on the x-axis in order of their number of insertions (blue). (Magenta) A distribution based on the random control data of MRC Hap_Mse_2. (B) The divergent intergenic regions were plotted on the x-axis in order of their number of insertions (blue). (Magenta) The corresponding random control MRC Hap_Mse_2. (C) The tandem intergenic regions were plotted on the x-axis in order of their number of insertions (blue). (Magenta) The corresponding distribution of random control MRC Hap_Mse_2. (D) The convergent intergenic regions were plotted on the x-axis in order of their number of insertions (blue). (Magenta) The random control MRC Hap_Mse_2.


