
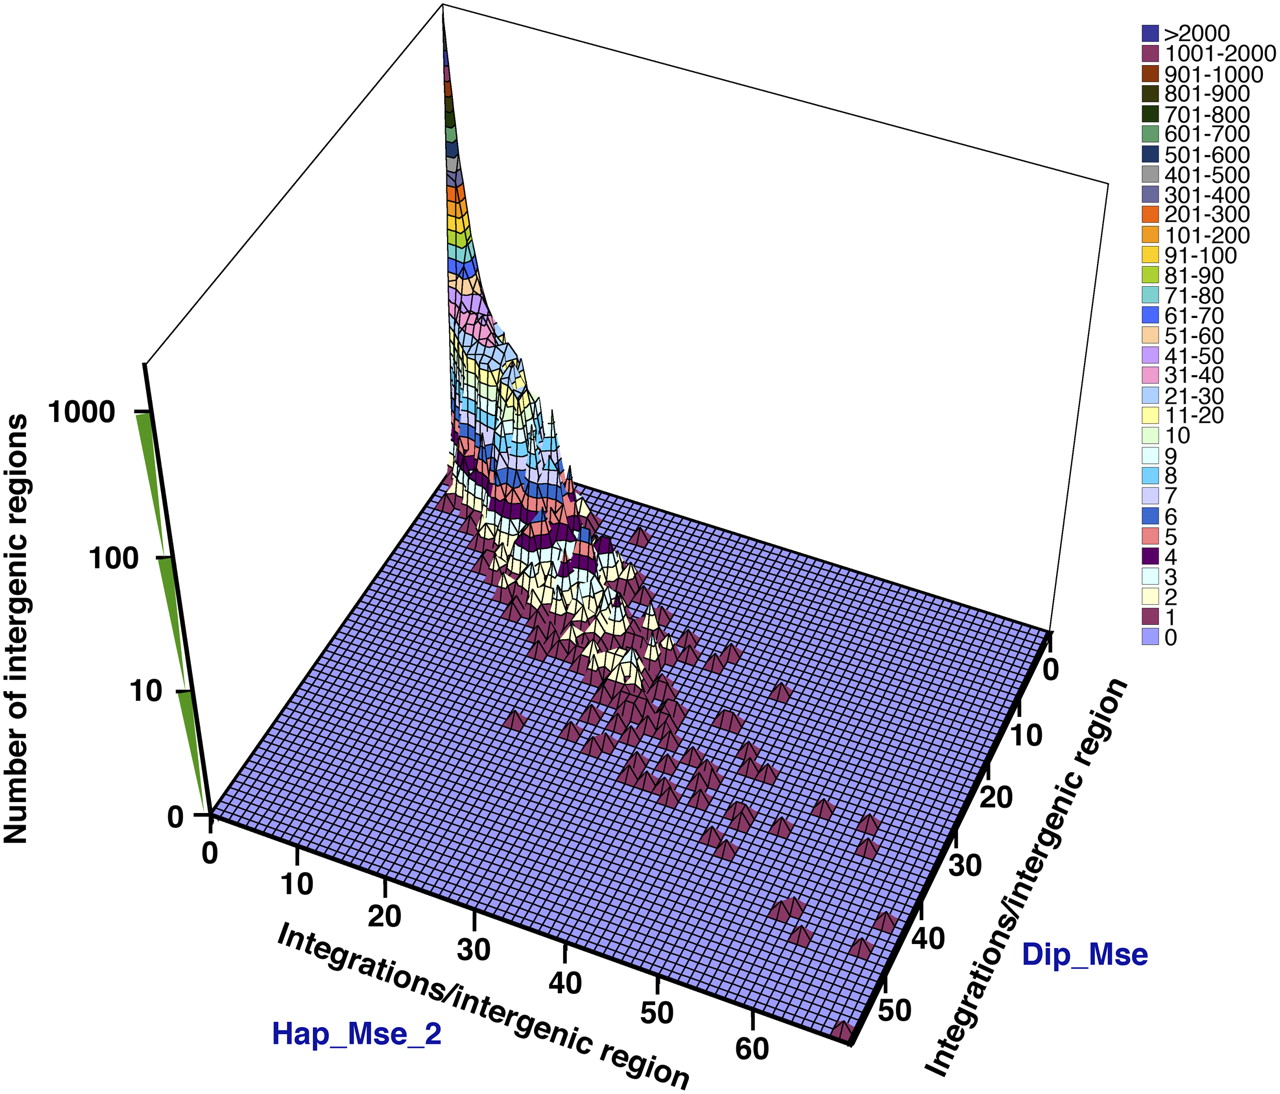
Figure 4.
Comparison between two experiments (Hap_Mse_2 and Dip_Mse) of the number of insertions within each intergenic region. Each unit of the surface represents a group of intergenic regions. The x coordinate shows the number of integrations/intergenic region in the Hap_Mse_2 data. The y coordinate shows the number of integrations/intergenic region in the Dip_Mse data. The z coordinate has a log scale and shows the number of intergenic regions with the same x and y coordinates. The colors of the surface and the associated key represent values of the z coordinate.


