
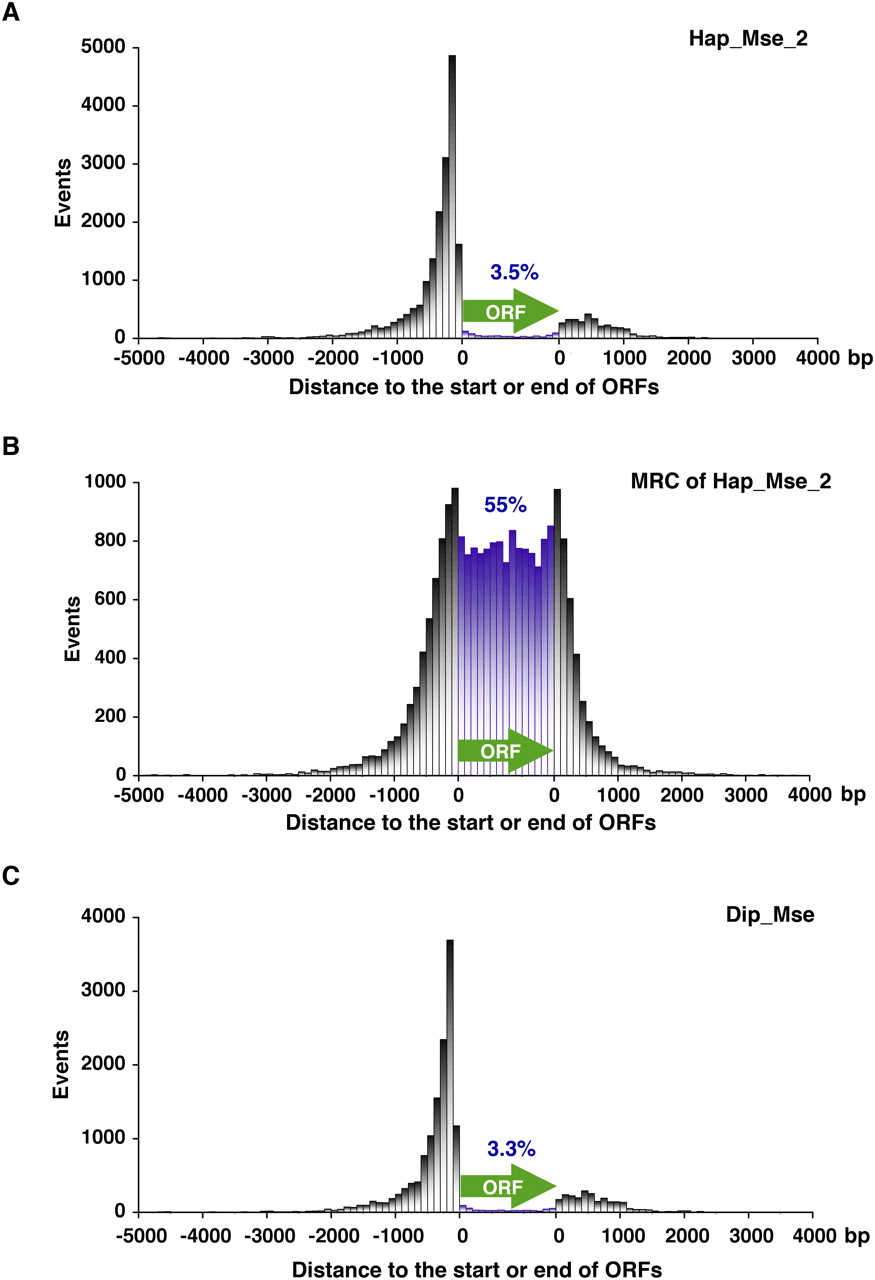
Figure 2.
The distance from Tf1 integration sites to the nearest ORF. The x coordinate is the distance from the 5′ and 3′ ends of ORFs. The y coordinate shows the number of integration events within bins of 100 bp. Insertions closer to the 5′ end of an ORF were plotted upstream of the ORF (green arrow), while insertions closer to the 3′ end of an ORF were plotted downstream of ORF. Insertions within ORFs were tabulated within 15 bins of equal proportion. The percentage of the independent integrations in ORF was labeled. (A) Hap_Mse_2; (B) MRC for Hap_Mse_2; (C) Dip_Mse.


