
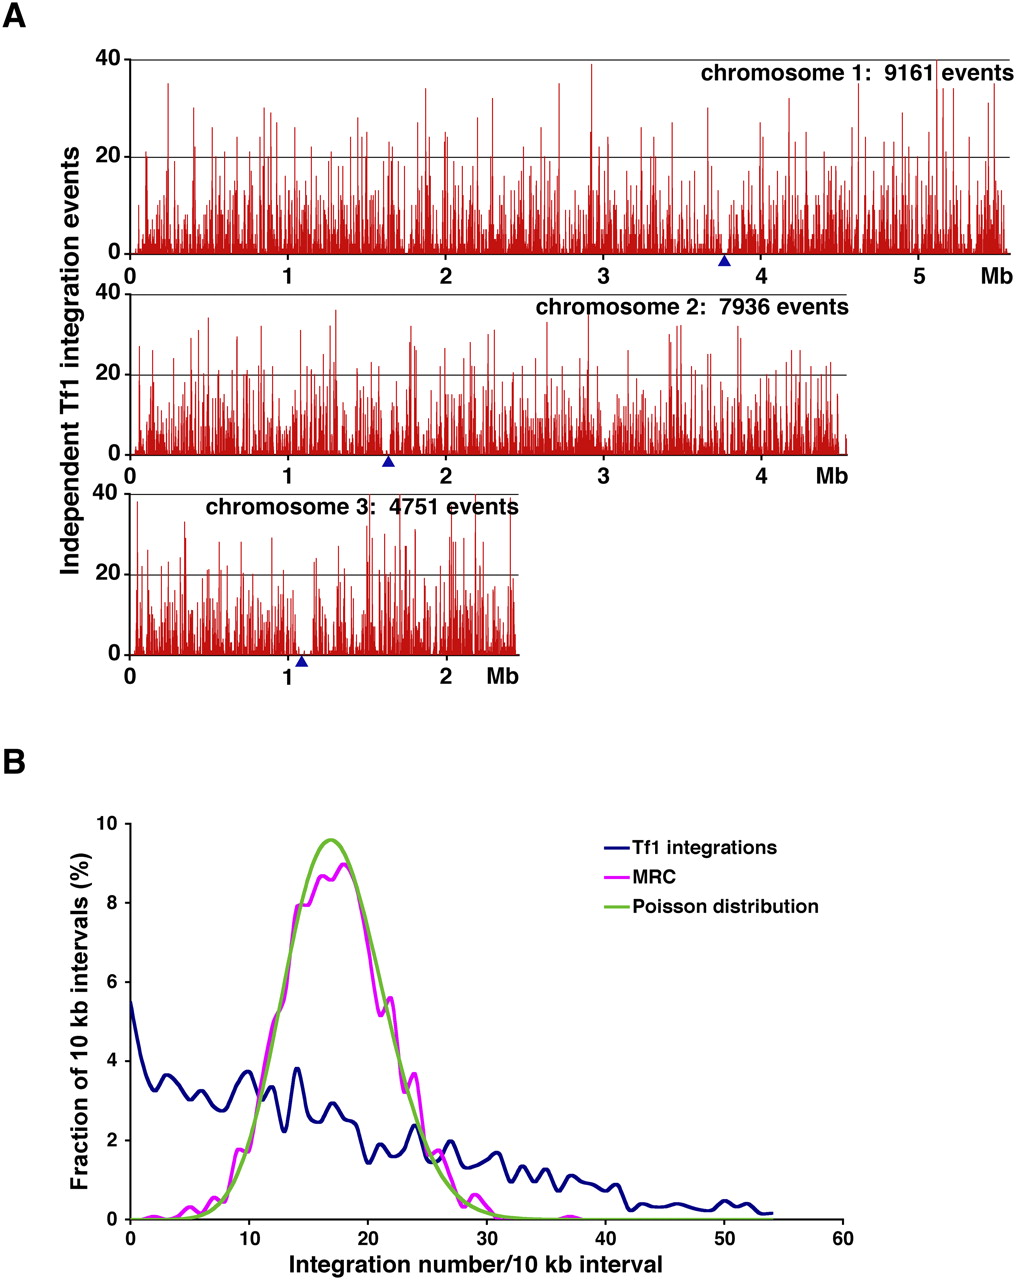
Figure 1.
The distribution of Tf1 integration in the genome of S. pombe. (A) The numbers of independent insertion events from the Hap_Mse_2 experiment are shown within 1 kb intervals of the three chromosomes of S. pombe. The positions of centromeres are indicated by blue triangles. The total number of independent integration events in each chromosome are labeled. (B) The distribution of Tf1 integrations within10-kb intervals of the S. pombe genome is shown for the Hap_Mse_2 experiment. Also shown are the distribution of the random control (MRC of Hap_Mse_2, magenta) and the Poisson distribution (green) based on the mean of the integration data.


