
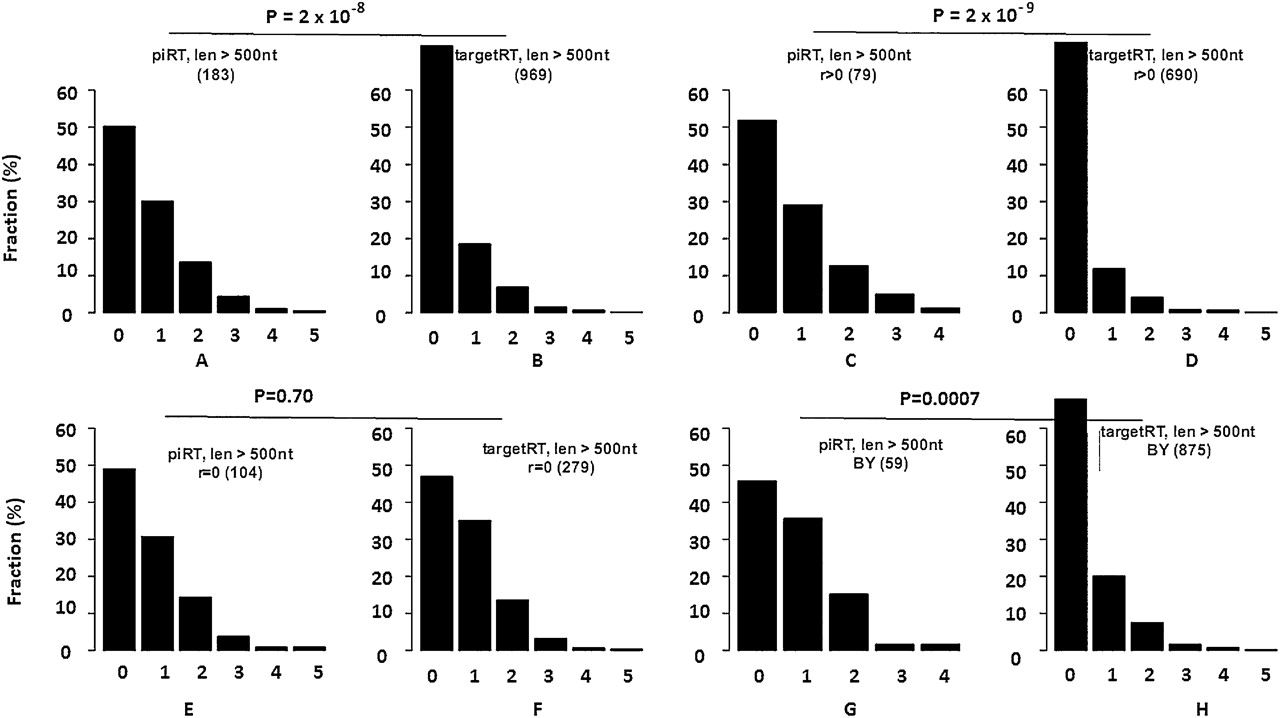
Frequency spectra of retrotransposons and other TEs. (A vs. B) The frequency spectra of piRT insertions are significantly skewed to higher frequencies than those of the targetRT insertions (only retrotransposons longer than 500 nt are considered). The difference in frequency spectra is statistically significant in the regions where recombination occurred (C vs. D), but vanishes in regions where recombination does not occur (E vs. F). (G vs. H) The difference in frequency spectra of piRT versus targetRT insertions is statistically significant if we use the piRNA loci defined by both Brennecke et al. (2007) and Yin and Lin (2007). (BY) piRNA locus defined by both Brennecke et al. (2007) and Yin and Lin (2007). The numbers in parentheses are the number of retrotransposons in that category. The x-axis is the frequency of insertion out of the nine strains of D. melanogaster. “0” means the insertion is only restricted in the reference genome of D. melanogaster. The y-axis is the proportion (%) of retrotransposon insertions with distinct frequency across the nine strains.


