
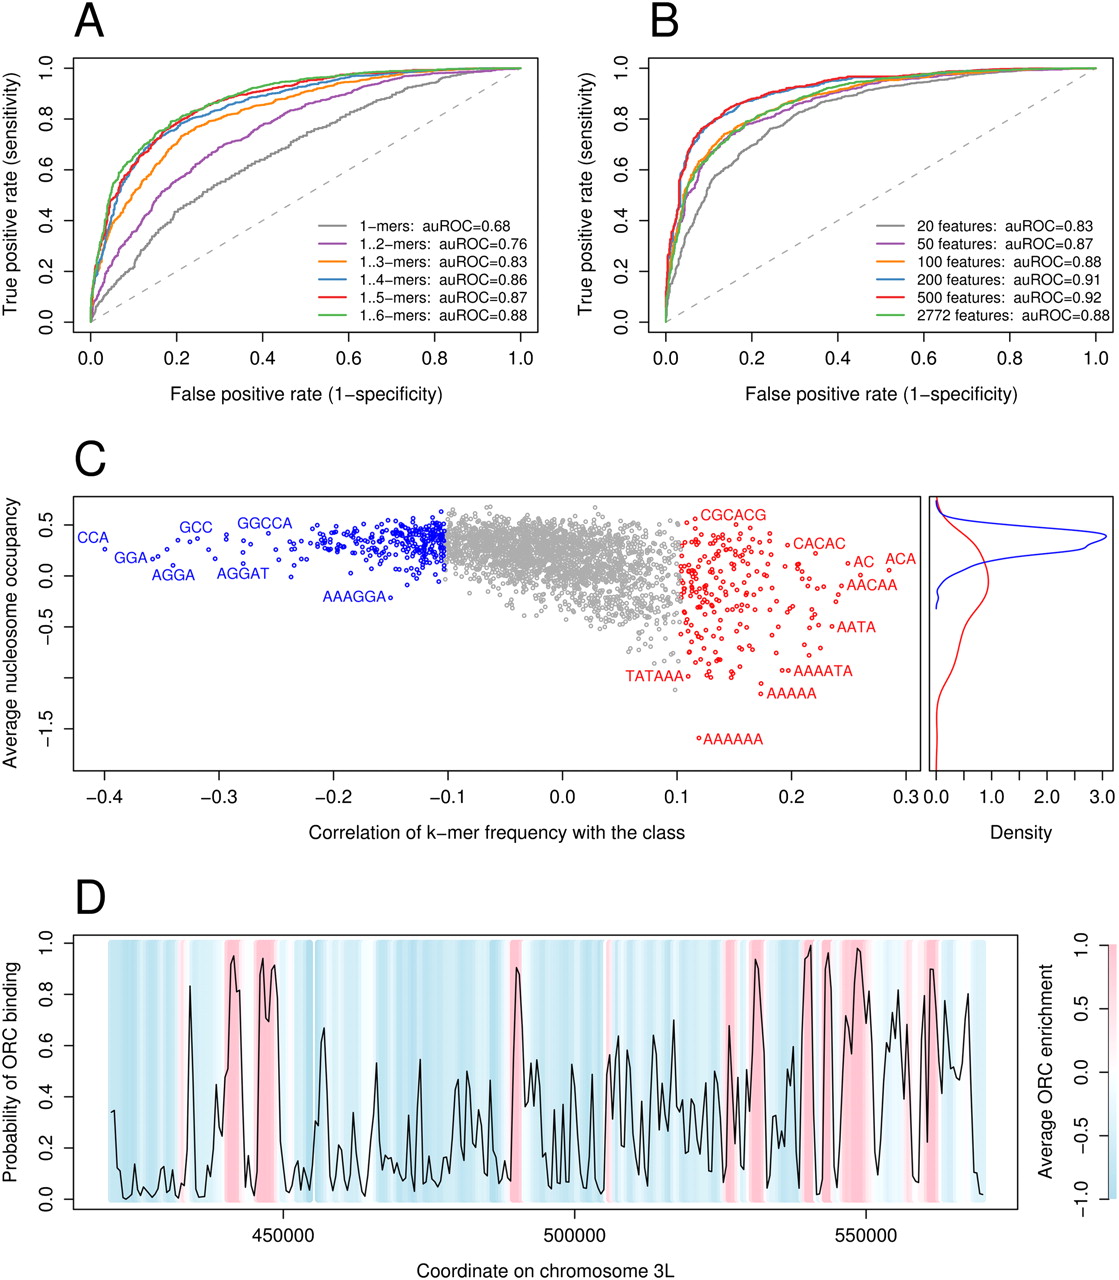
Sequence elements can discriminate between ORC-associated and ORC-free sequences. (A) ROC curves for SVM classifiers trained using as features the frequencies of k-mers for k = 1 to K, for increasing values of K. (B) ROC curves for SVM classifiers using subsets of features of increasing size. For each size of the feature set, we selected features with the highest absolute Pearson correlation with the class value (+1 or −1). All ROC curves were computed on the test set. (C) Correlation between k-mer features and class value, versus the average nucleosome occupancy over k-mers. The blue and red dots in the left plot correspond to the 500 features used in our analysis. The remaining features are shown in gray. The right plot shows the distributions of average nucleosome occupancy for the features with very high (red curve) and very low (blue curve) correlation coefficients. The average nucleosome occupancy values were computed from high-resolution in vitro nucleosome positioning data (Kaplan et al. 2009). (D) Predicted ORC binding for an arbitrary region on chromosome 3L. The background shows the average ORC2 ChIP enrichment; (blue) low enrichment; (pink) high enrichment. (Black curve) The posterior probability of ORC binding is in good agreement with the average ORC2 enrichment.


