
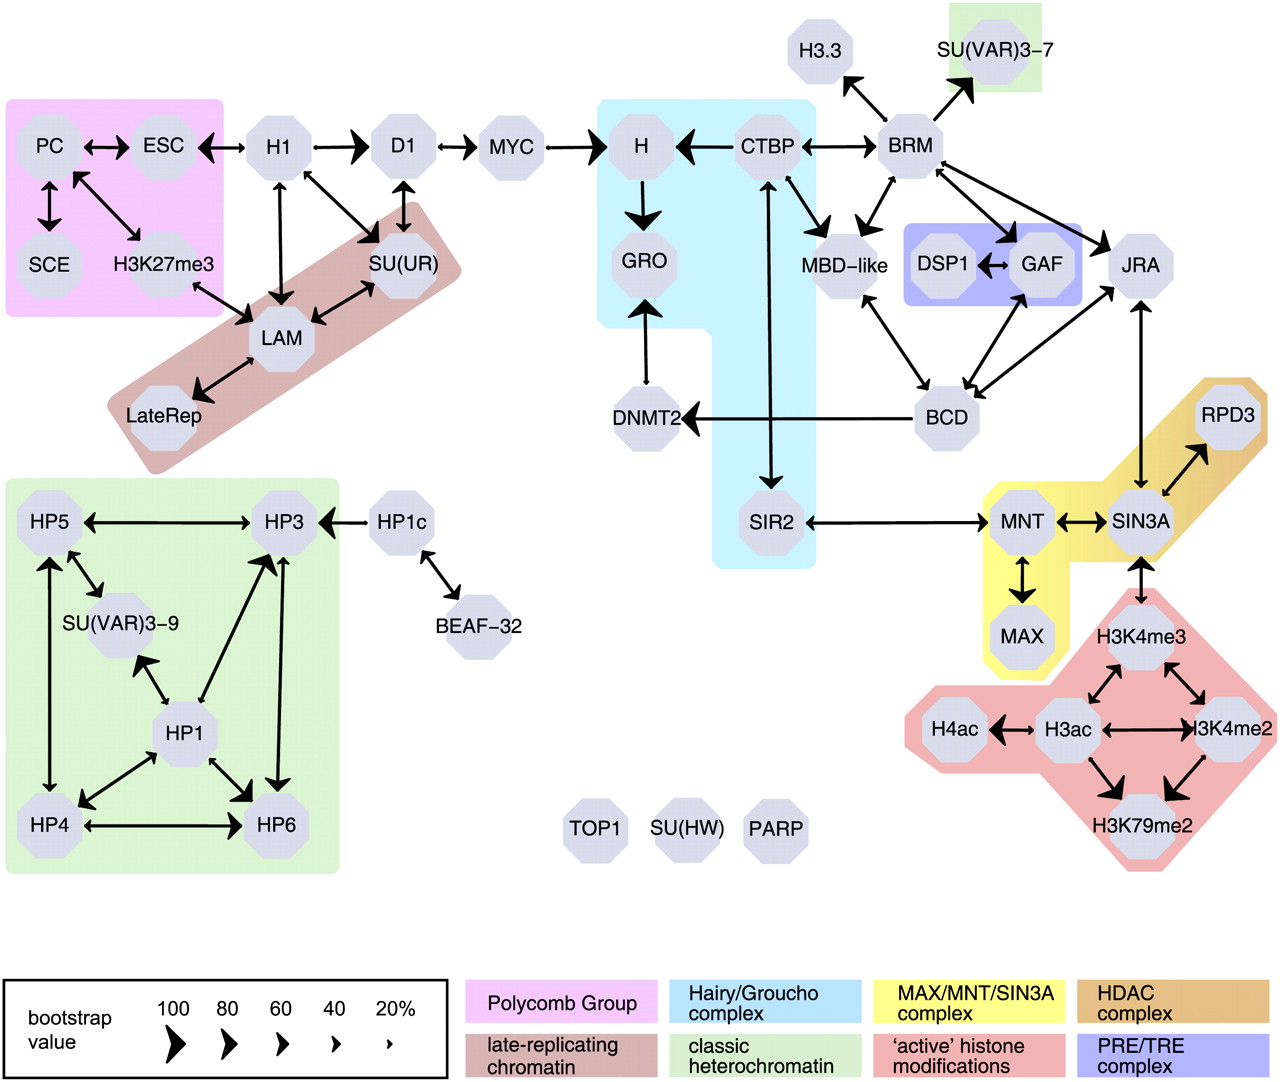
Figure 2.
Bayesian Network model BN80 of the targeting interactions between 43 chromatin components. Nodes represent chromatin components; edges represent predicted targeting interactions with a bootstrap score (combined for both directions) of at least 80%. The size of each arrowhead is proportional to the bootstrap score of the targeting interaction in the corresponding direction.


