
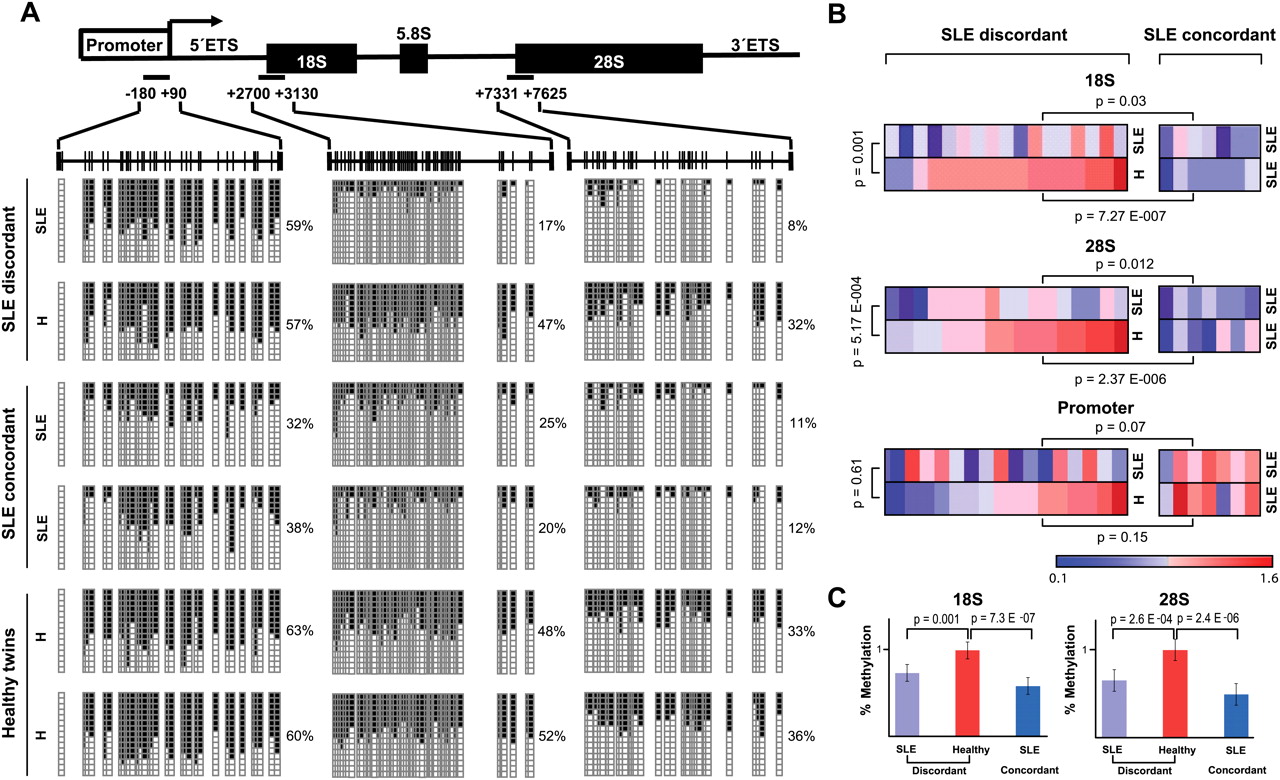
DNA methylation changes in ribosomal genes in paired samples discordant for SLE. (A) Schematic representation of the rRNA gene depicting three regions in the gene repeat: the proximal promoter, including the transcription start site, and the initial sections of the 18S and 28S regions, were subjected to bisulfite genomic sequencing. Fifteen clones are shown. (Black squares) Methylated CpG sites; (white squares) non-methylated CpG sites. One SLE discordant pair of MZ twins, one SLE concordant pair of MZ twins, and one concordant pair of healthy MZ twins are shown. (B) Heat map including the normalized methylation data for 17 pairs of SLE-discordant samples and seven pairs of SLE-concordant samples. Data are normalized with respect to the average value of healthy siblings from discordant twin pairs, and a color scale is established between no-methylation (blue) and methylation (red) values near the average of normal samples. Three comparisons are made: SLE siblings from discordant pairs versus SLE twins from concordant pairs (upper P-value); healthy siblings from discordant pairs versus SLE twins from concordant pairs (lower P-value); SLE siblings from discordant pairs versus their matching healthy twins (P-value at left). (C) Bar graph showing the average percentage of DNA methylation for the 18S and 28S sequences of SLE siblings from discordant twin pairs, healthy siblings from discordant twin pairs, and SLE individuals from concordant twin pairs.


