
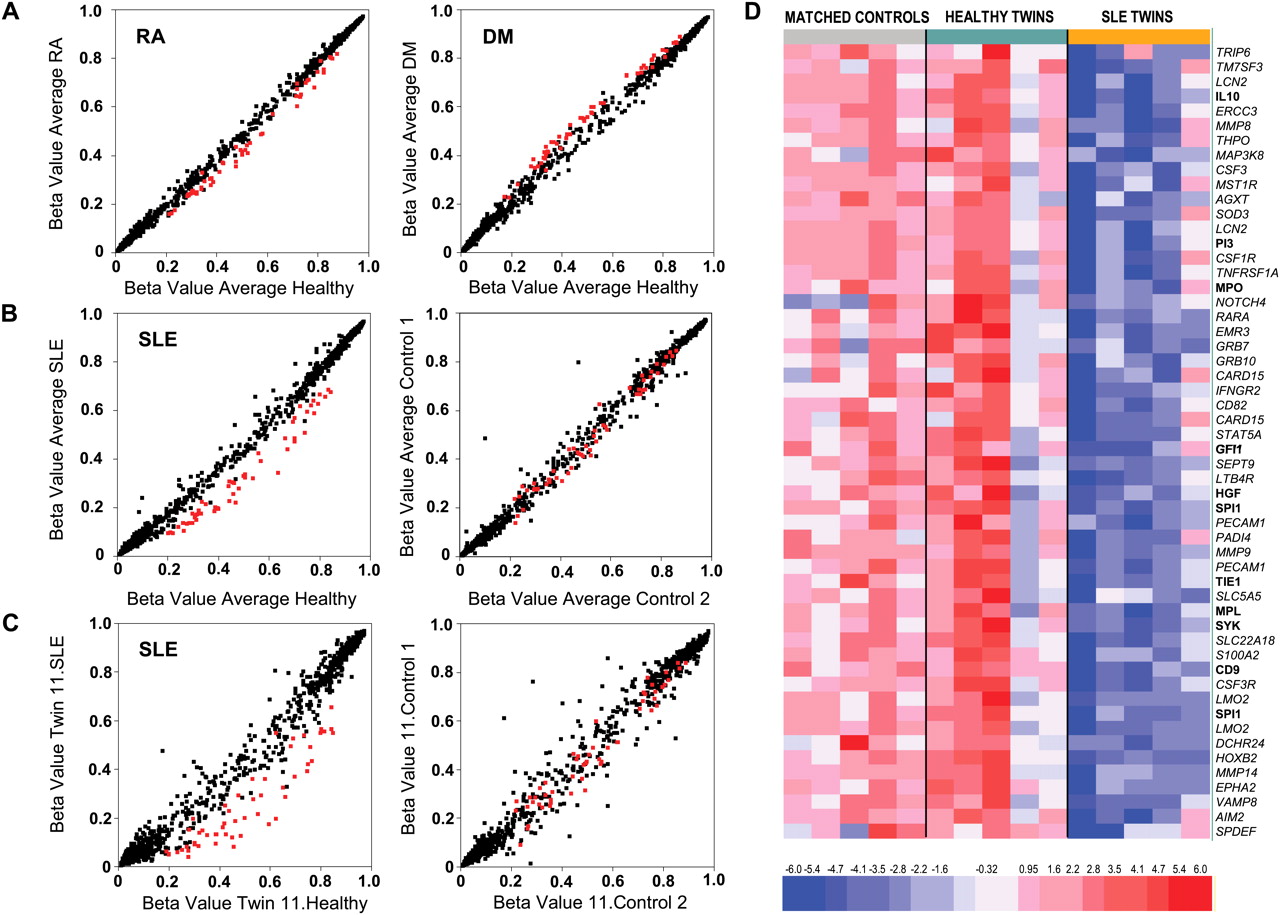
Representative scatterplots showing methylation profiles of twins with the three autoimmune diseases studied (SLE, RA, and DM) compared with their respective healthy twins. (A) Scatterplots corresponding to the average data from five MZ twin pairs discordant for RA (left) and DM (right). (Red) Genes with significant differences in averaged results from five SLE-discordant MZ twin pairs (see below). (B) (Left) Scatterplot corresponding to the averaged results from five SLE-discordant MZ twin pairs. (Right) Comparison of the averaged data of five pairs of unrelated controls matched by race, age, and gender with samples from the left panel. (Red) Significant genes (β > 0.10, P < 0.05). (C) (Left) A comparison of a single SLE-discordant MZ twin pair. (Red) Genes with significant differences in averaged results from five MZ twin pairs (see above). (D) Heat map including the data for the 49 genes (54 probes) showing differential methylation between SLE affected and healthy MZ twin pairs (five samples were included). Five additional age-, gender-, and race-healthy controls for each of the five MZ twin pairs are also included. Data from the Illumina array have been normalized as follows: xi = (xi − row.mean[i])/(0.333 × row.sd[i]). A scale is shown at the bottom, whereby positive (red) and negative (blue) values correspond, respectively, to a higher and a lower methylation status than average.


