
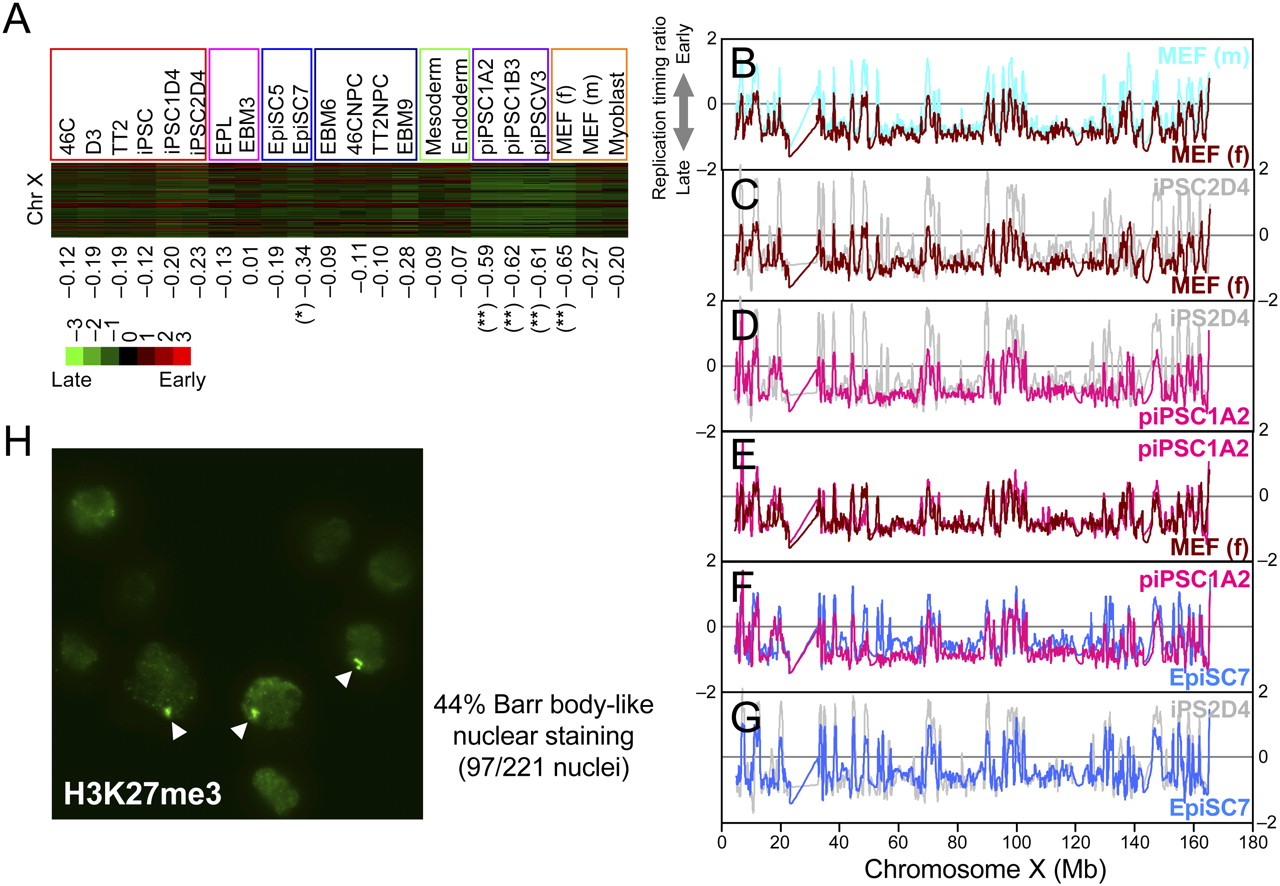
Analysis of late replicating inactive X chromosome. (A) Heatmap representation of replication timing of all 200-kb segments along the X chromosome in 22 cell lines. Below are the chromosome average replication-timing ratios. Note that piPSCs and female MEFs show markedly later replication timing (**). Female EpiSC7 is also later replicating (*). Female cell lines include iPSC1D4, iPSC2D4, EpiSC7, piPSC1A2, piPSC1B3, piPSCV3, and MEF (f); all others are male lines. (B–G) Pairwise comparisons of smoothed replication-timing profiles of the X chromosome. Note the difference between cell types, particularly at the early replicating peaks along the chromosome. (Note: Coordinates 23–32 Mb exhibit large gaps in probes due to highly repetitive sequences.) (H) H3K27me3 staining of EpiSC7. Forty-four percent of the cell population showed Barr body-like nuclear staining (arrowheads) of H3K27me3.


