
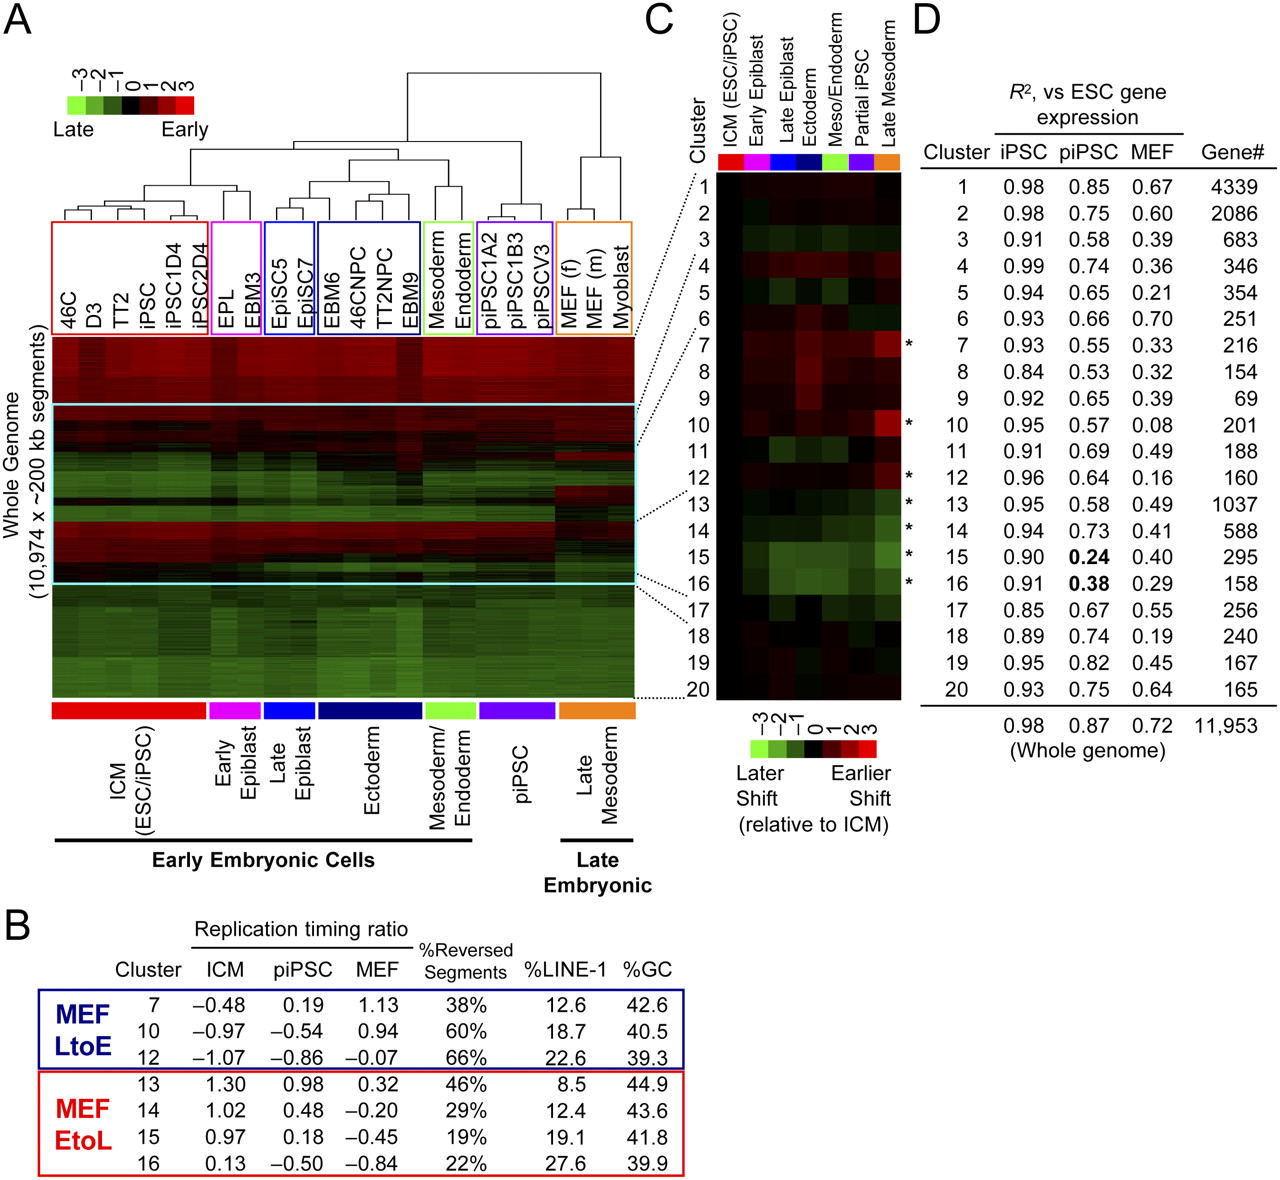
Lineage-independent early-to-late replication-timing changes are difficult to reprogram. (A) Hierarchical clustering of 22 cell lines, with the addition of piPSCs (1A2, 1B3, V3) and iPSCs (1D4, 2D4) (Maherali et al. 2007), using K-means clusters 4–17 defined in Figure 6A (framed in blue). (B) Properties of seven K-means clusters (identical clusters as in Fig. 6A–C) that showed large differential (>0.95) between MEFs and ICM. The fifth column (% Reversed Segments) shows the difficulty of regaining ESC-specific replication timing in piPSCs derived from MEFs. The numbers represent the percentage of 200-kb segments that showed more than 75% recovery in replication timing in piPSCs. (C) Average replication-timing differential of K-means clusters 1–20 relative to ICM in a heatmap format (identical clusters as in Fig. 6A–C). Here, red and green represent earlier and later shifts, respectively. (Asterisks) Clusters analyzed in B. (D) Pearson's R2-values for pairwise comparisons of gene expression in iPSCs, piPSCs, and MEFs to ESCs within each of the 20 clusters. At the bottom of the table is the whole genome comparison. Note that clusters 15 and 16 deviate considerably from the rest of the genome when piPSCs and ESCs are compared, indicating that gene expression program in these clusters is particularly resistant to reprogramming, in contrast to other clusters and the whole genome comparison. Gene expression levels are based on the work of Sridharan et al. (2009) (Supplemental Table 2).


