
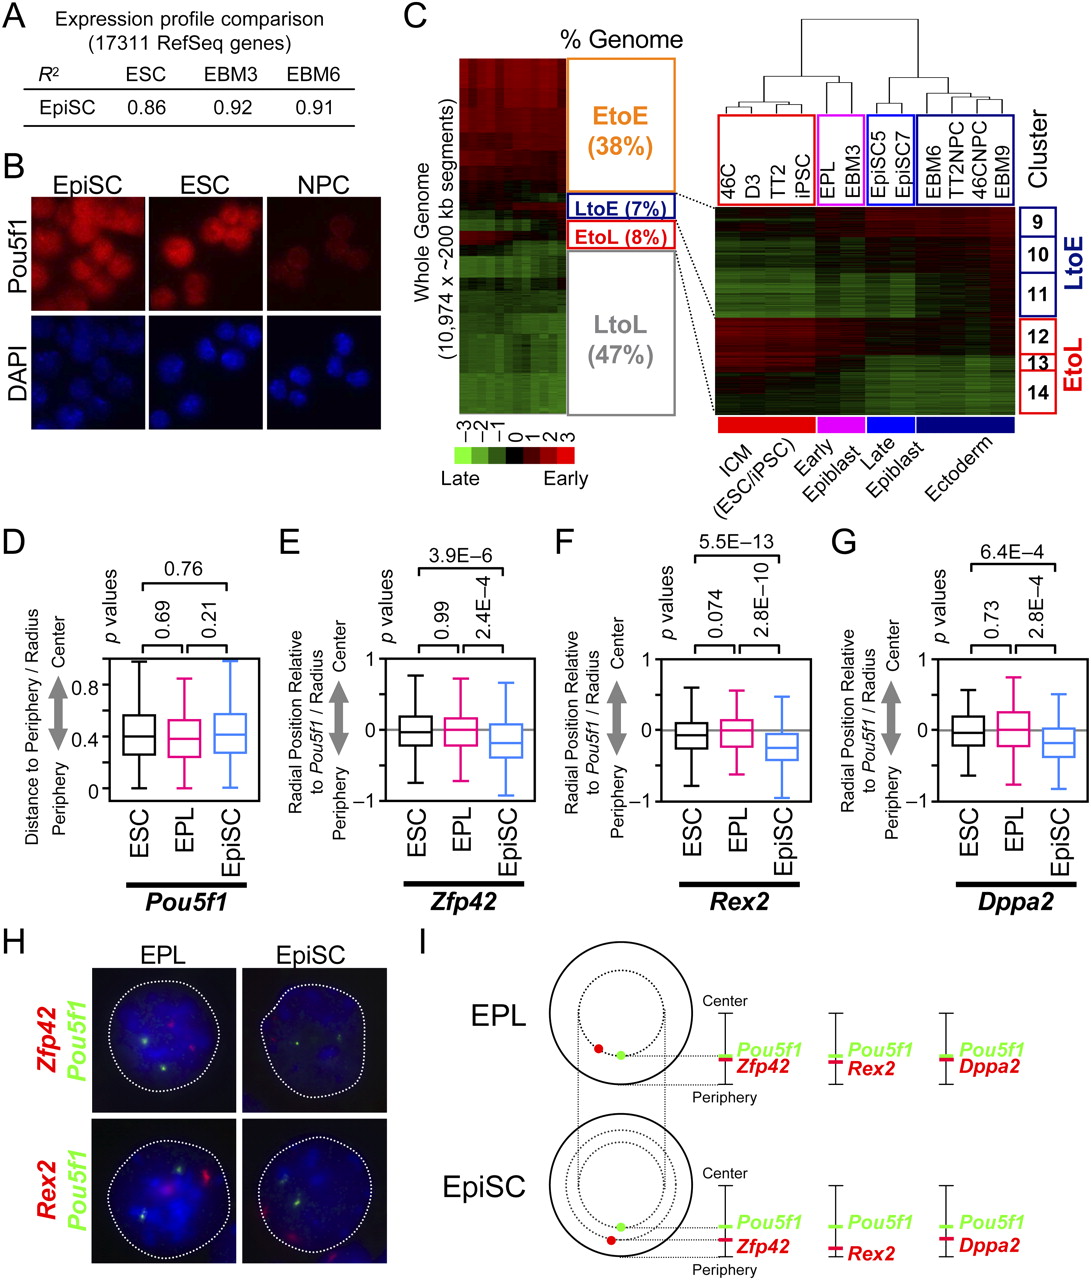
Lineage-independent replication-timing changes are completed at the EpiSC stage, coincident with spatial repositioning of early-to-late domains. (A) Pearson's R2-values for pairwise comparisons of gene expression microarray profiles of 17,311 RefSeq genes. EpiSC shows the highest correlation to EBM3. (B) Immunostaining confirms POU5F1 expression in EpiSC5 (89% positive; 88% for EpiSC7 [data not shown]). The identical EpiSC batches were used for replication analysis. ESCs and NPCs are positive and negative controls, respectively. (C) Hierarchical clustering of 12 cell lines. The whole genome was divided into 10,974 ∼200-kb segments and their average replication-timing ratios were compared between cell lines. (Left) A whole-genome heatmap and the percentages of segments that stay early (EtoE), stay late (LtoL), shift earlier (LtoE), and shift later (EtoL), based on a K-means clustering (K = 20). LtoE and EtoL clusters were defined as those that show a replication-timing differential of above 1.0 between any cell types. With this stringent cutoff, 15% of the genome exhibited differences (as opposed to 20% with a less stringent cutoff; Hiratani et al. 2008). Clusters 9–14 correspond to LtoE and EtoL segments used for hierarchical clustering on the right. The dendrogram draws a clear distinction between EPL/EBM3 and EpiSCs, which corresponds to early and late epiblast stages, respectively. Cell lines not described in this study are from Hiratani et al. (2008). (D–I) Two-color 2D DNA-FISH in ESCs, EPL cells, and EpiSCs (EpiSC7 line). (D) Pou5f1, which is early replicating in all three cell lines, maintains its internal positioning. Box plots show the distribution of relative radial distance to the periphery, where 0 and 1 represents the periphery and the center of the nucleus, respectively. Relative radial distance medians were 0.40 (ESC), 0.38 (EPL), and 0.42 (EpiSC). N = 222–430. (E–G) Subnuclear positioning of EtoL loci (Zfp42, Rex2, and Dppa2) relative to Pou5f1. Radial distance of Pou5f1 loci to the nuclear periphery was subtracted from that of Zfp42 (E), Rex2 (F), or Dppa2 (G) loci for all four combinations of allele pairs within a given nucleus, divided by the radius and their distribution was plotted as box plots. Most peripheral, identical, and most internal positioning of these loci relative to Pou5f1 are represented by –1, 0 and 1, respectively. P-values were obtained from a two-sample Kolmogorov-Smirnov test. All three EtoL loci exhibited significant repositioning toward the periphery in EpiSCs, but not others. N = 120–384. The identical data sets are also shown using cumulative frequency plots (Supplemental Fig. 10). (H) Representative images of 2D DNA-FISH. (I) Summary of 2D DNA-FISH. Positions shown for each locus (red, EtoL loci; green, Pou5f1) represent the median relative radial distance to the nuclear periphery, showing repositioning of EtoL loci toward the periphery in EpiSCs, but not EPL cells. In EPL cells, median values were: Zfp42 (0.40), Rex2 (0.30), and Dppa2 (0.42). In EpiSCs, median values were: Zfp42 (0.23), Rex2 (0.11), and Dppa2 (0.27).


