
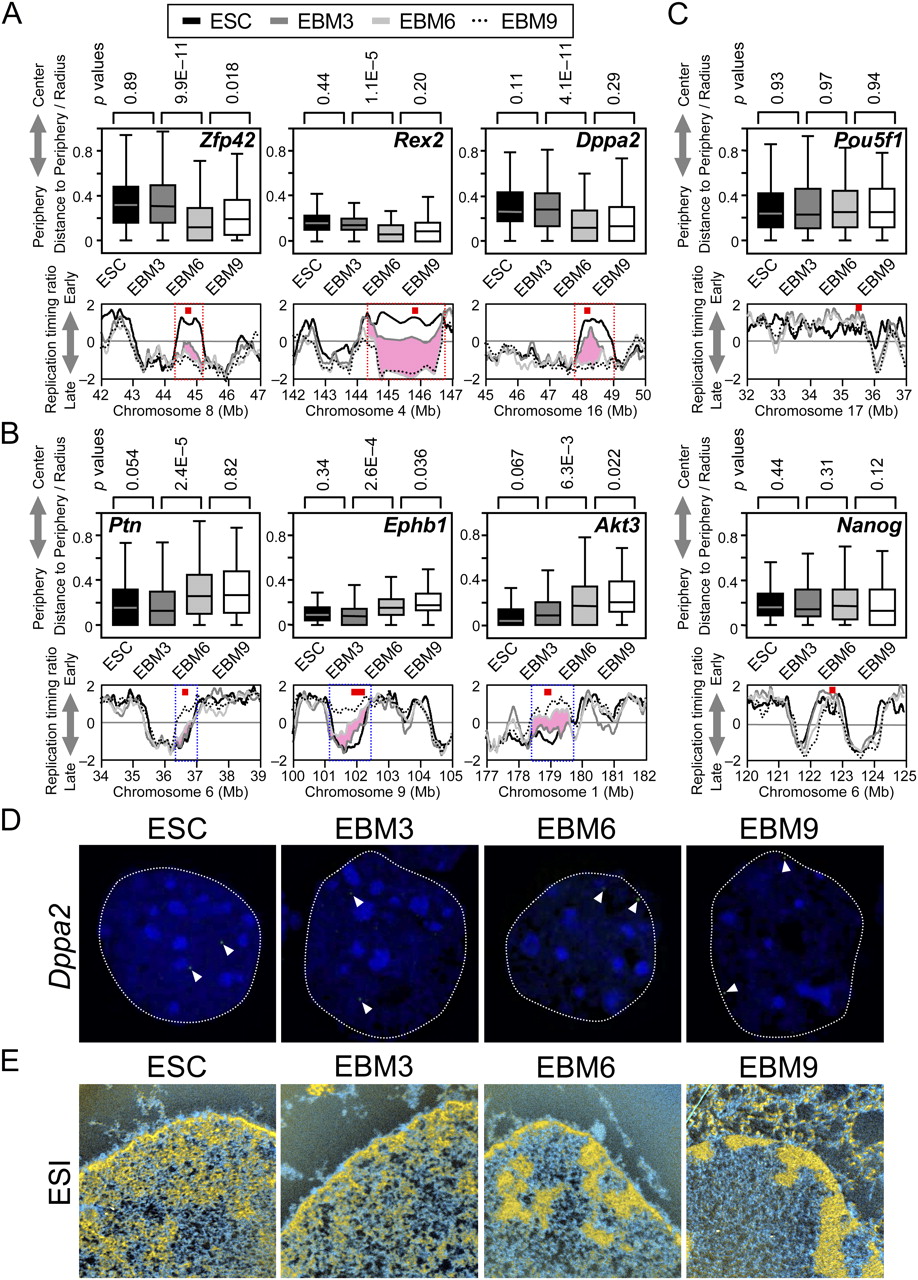
Subnuclear repositioning associated with replication-timing changes occurs during the EBM3–EBM6 transition, in parallel with chromatin fiber reorganization. (A–C) Analysis of subnuclear positions of eight genomic regions by 3D DNA-FISH in EBM3 and EBM6. ESC and EBM9 data (Hiratani et al. 2008) are also shown for comparison. Box plots show the distribution of relative radial distance to the nuclear periphery, where 0 and 1 represents the periphery and the center of the nucleus, respectively. Horizontal bars represent the 10th, 25th, 50th (median), 75th, and 90th percentiles. P-values were obtained from a two-sample Kolmogorov-Smirnov test. Below the box plots are the overlays of the four replication-timing profiles (using the color code at the top) with the probe gene positions (red squares). All EtoL domains (A; Zfp42, Rex2, and Dppa2) and LtoE domains (B; Ptn, Ephb1, and Akt3) analyzed make the most significant movement toward and away from the nuclear periphery, respectively, during the EBM3–EBM6 transition. During this period, replication-timing changes traverse the mid-late S-phase (pink shades), which is when a dramatic interior to peripheral transition in the spatial patterns of DNA replication foci occurs (Hiratani et al. 2009). In contrast, two EtoE domains (C; Pou5f1 and Nanog) do not change subnuclear positioning or replication time. Comparable results were obtained from two to four biological replicates, and the sum of all experiments is shown. Seventy-one to 223 FISH signals were measured per state. The identical data sets are also displayed using cumulative frequency plots (Supplemental Fig. 5). (D) Representative FISH images of Dppa2. Dotted lines represent the rim of nuclear DAPI signals. Arrowheads point to green FISH signals. (E) Electron spectroscopic imaging (ESI) analysis of nuclei from ESC, EBM3, EBM6, and EBM9. Relative levels of phosphorus and nitrogen levels were used to delineate chromatin (yellow) vs. protein and ribonucleoprotein (blue) (Bazett-Jones et al. 2008).


