
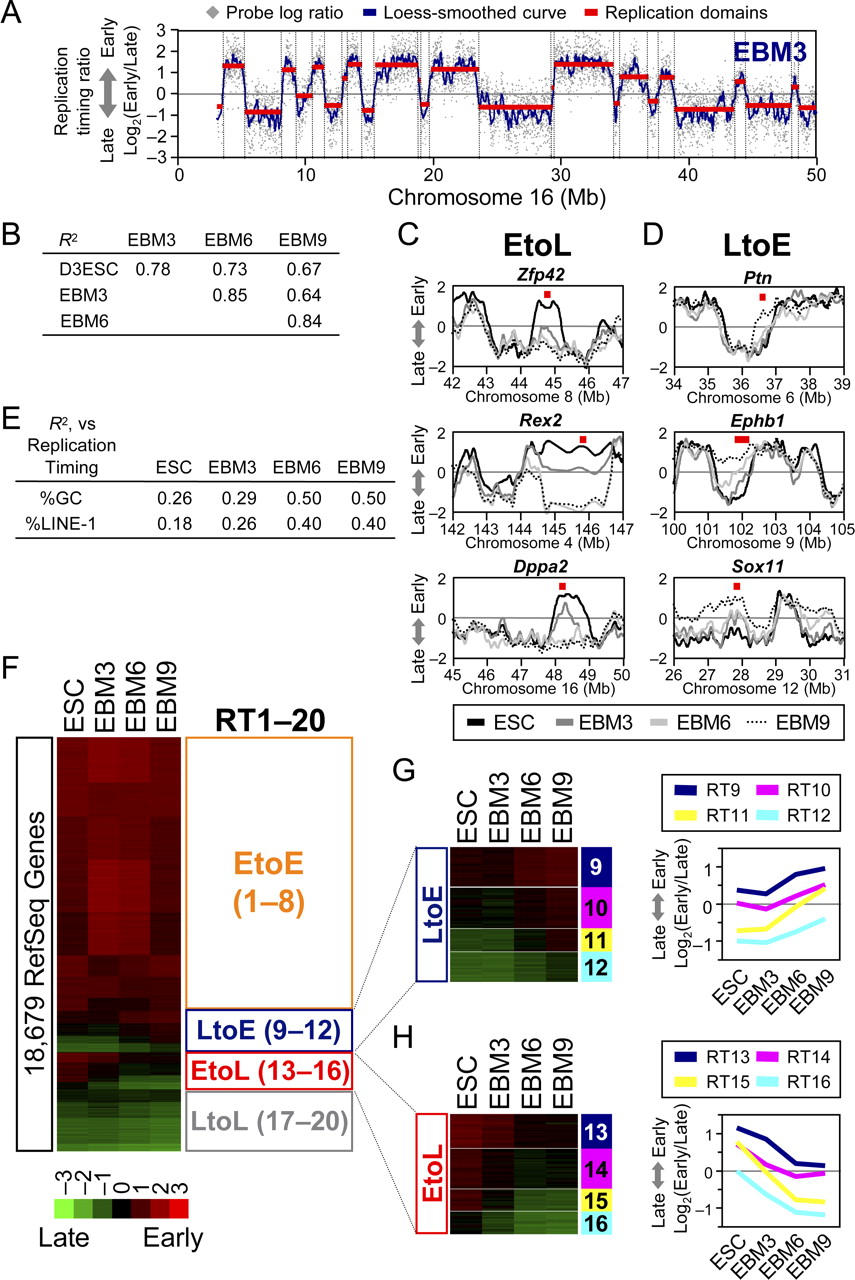
Kinetics of replication-timing changes during neural differentiation of ESCs. (A) Replication-timing profiling. Exemplary profile of EBM3 is shown. (Gray dots) Probe log ratios [=log2(Early/Late)] along chromosome 16. A local polynomial smoothing (loess) curve is overlaid (blue). Replication domains (red lines) and their boundaries (dotted lines) identified by segmentation are also overlaid (Hiratani et al. 2008). (B) Pearson's R2-values for pairwise comparisons of replication timing. Smoothed data for all probes were used for the calculation. (C,D) Overlaid replication-timing profiles of ESC, EBM3, EBM6, and EBM9, at selected EtoL domains (C) and LtoE domains (D), using the color code at the bottom. Representative genes within the domains are shown with their chromosomal positions in red squares. (E) Pearson's R2-values are shown for the relationship between average replication-timing ratios of replication domains vs. their %GC and %LINE-1 values in ESC, EBM3, EBM6, and EBM9. (F) A heatmap showing replication-timing ratios [=log2(Early/Late)] of 18,679 RefSeq genes based on the microarrays using the color code shown. Genes are ordered based on a K-means clustering into 20 replication-timing clusters with distinct patterns. Orange, blue, red, and gray boxes represent EtoE (RT1–8), LtoE (RT9–12), EtoL (RT13–16), and LtoL (RT17–20) clusters, respectively (kinetics in G,H and Supplemental Fig. 4). (G,H) Magnified views of LtoE (G, RT9–12) and EtoL (H, RT13–16) clusters, respectively. Line charts show mean replication-timing ratios of each cluster.


