
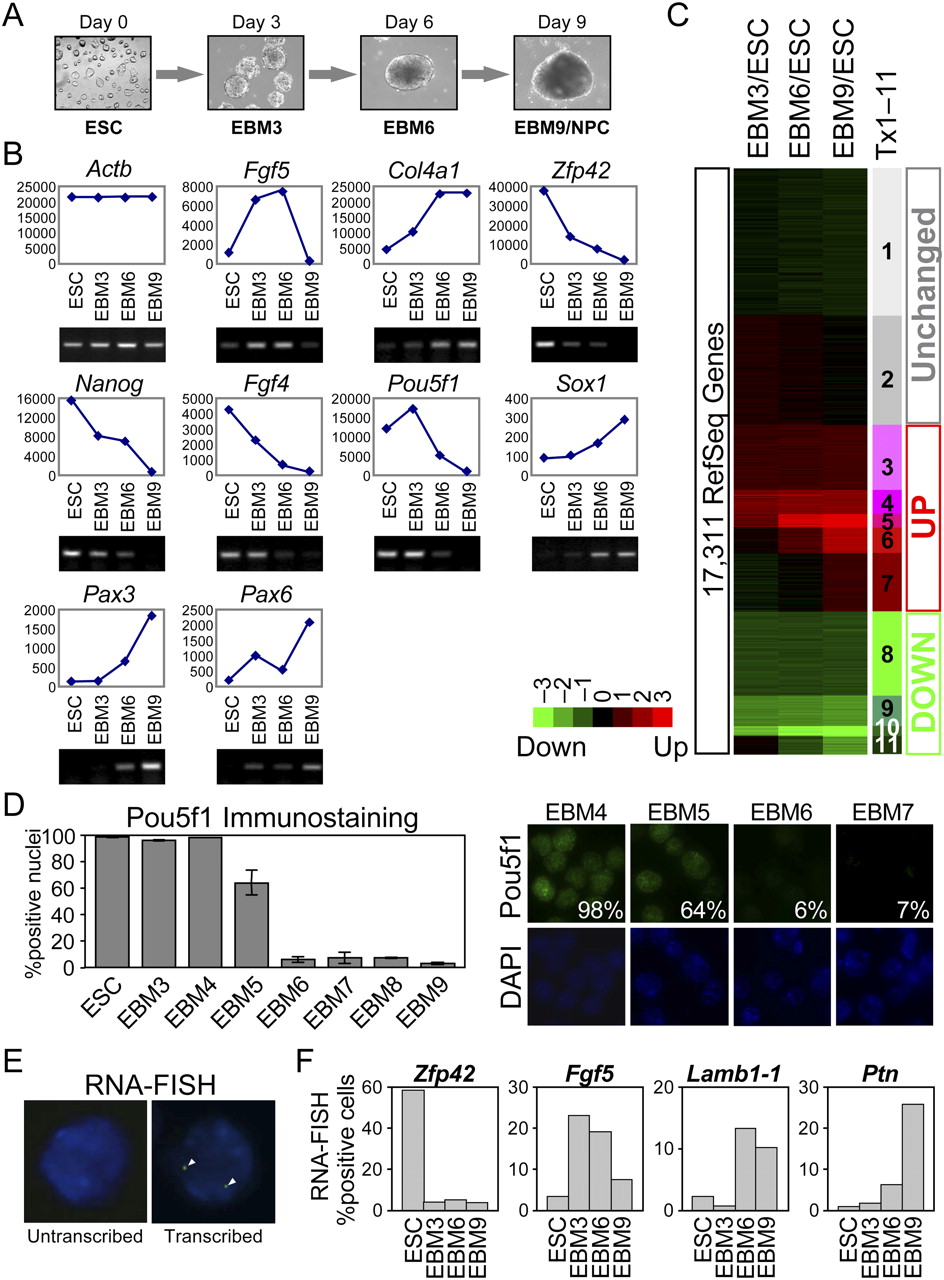
Synchronous differentiation of pluripotent ESCs to neurectoderm. (A) A 9-d neural differentiation scheme. See text for details. (B) Analyses of steady-state mRNA levels by microarrays (line charts; y-axis, arbitrary units) and reverse transcriptase (RT)-PCR (gel images) at 3-d intervals. See text for details. Actb (beta actin), loading control. (C) A heatmap showing 17,311 RefSeq genes present on the gene expression microarray, where each horizontal line represents a single gene. Log2 transformed ratios of steady state mRNA levels in EBM3, EBM6, and EBM9 to those of ESC are displayed using the color code shown. Genes are ordered based on a K-means clustering into 11 expression clusters (Tx1–11) with distinct patterns, where gray (Tx1–2), red (Tx3–7), and green (Tx8–11) color spectra show unchanged, up-regulated and down-regulated clusters, respectively. (D) Synchronous elimination of POU5F1 from nuclei. (Left) ESC and EBM3–9 were scored for POU5F1-positive nuclei. Similar results were obtained from three experiments and their average is shown. We scored over 330 nuclei for EBM5 and EBM6, while 54–302 were scored for others. Error bars represent standard error of the mean. (Right) Representative images from EBM4, EBM5, EBM6, and EBM7 are shown. Top, POU5F1 (green); bottom, DAPI (blue); Percentages, POU5F1-positive nuclei. (E,F) RNA-FISH reveals synchronous changes in transcription of tissue-specific genes. (E) Representative images of cells with and without RNA-FISH signals (arrowheads). (F) RNA-FISH analysis at 3-d intervals. One representative experiment for each gene is shown. At least 147 nuclei were scored for each state. Similar results were obtained in at least two replicate differentiation series. Note that even highly expressed genes are not 100% positive due to the probabilistic nature of interactions with the transcription machinery (Mitchell and Fraser 2008).


