
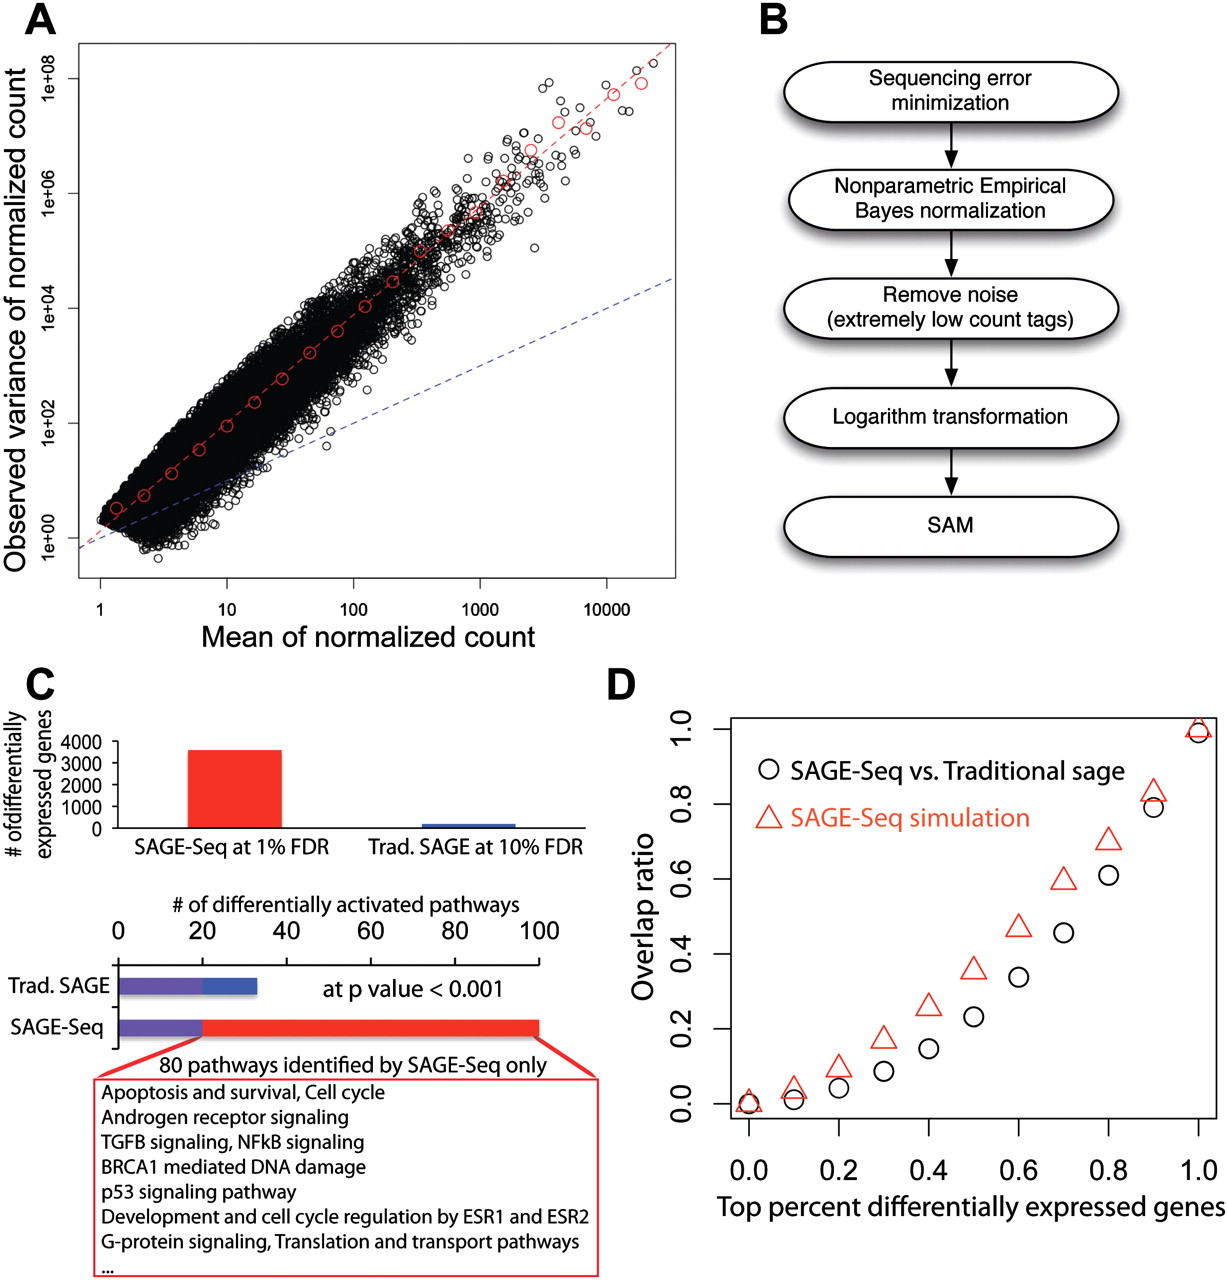
Differentially expressed genes and their variance. (A) Mean-to-variance plot for the seven normal libraries after removing the noise and normalization. Red dashed line is the best linear fit in log-log plot. The slope gives the exponent αobv ≈ 1.9 Blue dashed line is the mean-to-variance line introduced by sampling. (B) Pipeline for the identification of differentially expressed genes: (1) Sequencing error minimization: After tag alignment, tags that are mapped to the same genes at the same locations are combined together; (2) NEB is used to normalize different libraries with different sequencing depth; (3) filtering to remove tags with counts ≥3 per million in less than two libraries followed by log2 transformation; (4) SAM is used for the detection of differentially expressed genes. (C) Detected differentially expressed genes (top) and activated pathways (bottom) in SAGE-Seq and traditional SAGE. SAGE-Seq identifies approximately 4000 differential genes at 1% FDR, while traditional SAGE identifies <200 at a much looser cut off (10% FDR). At P = 0.001, SAGE-Seq identifies 99 pathways significantly activated in breast cancer, while traditional SAGE only shows 32. The 80 pathways only identified by SAGE-Seq and missed by traditional SAGE are all breast cancer-related pathways. (D) The overlap ratio (defined as the number of overlapping genes divided by the gene number in traditional SAGE in the top x percent differentially expressed genes, where x changes between 0 and 1. The black symbols depict actual data (SAGE-Seq vs. traditional SAGE). It indicates that there is little overlap in the top differentially expressed genes list between SAGE-Seq and traditional SAGE. The red symbols indicate simulation (SAGE-Seq vs. sampled down SAGE-Seq). Sampled down SAGE-Seq means to binomially sample 50 k tags from each SAGE-Seq library; 50,000 is a typical sequencing depth for traditional SAGE. Simulation confirms the same conclusion as that drawn from the actual data: SAGE-Seq gives a different top differentially expressed gene list compared with traditional SAGE. Deeper sequencing reveals that traditional SAGE identifies different sets of top differentially expressed genes than that of SAGE-Seq, confirming our conclusion that traditional SAGE lacks sufficient sequencing depth.


